diy solar

diy solar

Cal's DIY BMS

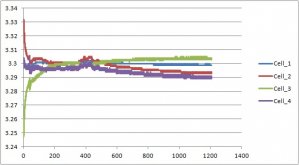
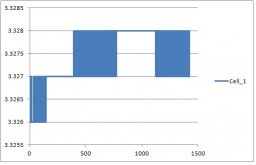
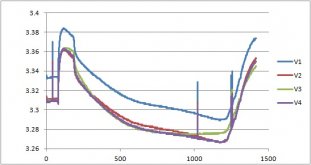
This plot shows cell 1 (scale to left) and cell 4 (scale to right) voltage with respect to ground. Everything looks fine the first 600 minutes (10 hours). Not sure what's going on after that. Perhaps a common bad connection? At around 1200 minutes, measurements totally flip out, both going to max readings. It sure looks like a connection/signal is lost.

Resistor going intermitent maybe? or just a bad connection?

What is your Vref for the voltage measurement? same one as for the current one?


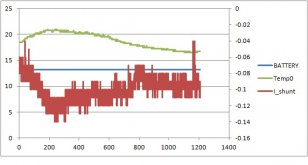
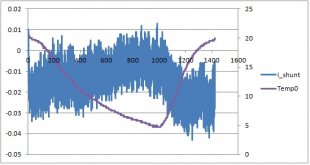
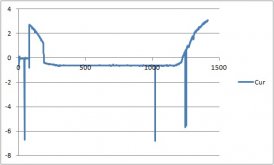
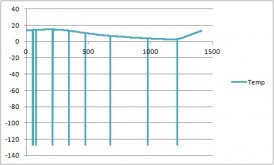
This plot show shunt current (which is shorted together at the circuit board) with scale to the right, and temperature with deg.C scale to the right. I'm not sure why the current is moving around like that. At least current is not totally flipping out around the 1200 minute mark. Current measurement and cell voltage measurements use the same adc1115. Both measurements use differential inputs.

Given there's around 109 LSB/A and the drift is around 1 A p-p it's very unlikely the problem comes from the ADC. My bet is on the op-amp offset drift and/or the Vref drift. 100 LSB would be 0.2 mV and the Vos of the op-amp is right around that value. The Vref specs are far better so I'd exclude it, not likely to be part of the problem.

Where did you source the components from? because if it's not from a reputable seller you may have some counterfeit components, or factory rejects, or crappier components rebadged as better ones, not meeting the specs in either case.
 
  • Like
Reactions: Cal
The adc1115 has an internal ref voltage (4.096V). There's a programmable gain stage. I'm using a gain of 16 to measure current (0.256V) and a gain of 2 to measure cell voltages (2.048V). I'm using 30 awg Kynar wire to wire-up the circuit. I've noticed if I'm not careful the solid wire can break, but still be held together by the insulation when preparing the wire for instillation. I'm running another test, this time indoors on a second set of cells. So far after 4 hours of run time all cell voltages match within reason with the Fluke meter.

All parts are from China.

I'm looking at other options. SBMS0 uses a battery cell monitor IC to measure cell voltages: ISL94202
That looks straight forward and workable. Except for the BGA package. Never heard of a package like that before. I actually retired from electronics 20 years ago. Getting into it again, but there's a lot that passed me by. DIY electronic projects are now difficult with those miniature parts.
 
All parts are from China.

I doubt your first problem is related to that but the second one might be. you can try getting the op-amp from reputable seller and see if it improves things. But first confirm the drift comes from it of course ;)


I'm looking at other options. SBMS0 uses a battery cell monitor IC to measure cell voltages: ISL94202
That looks straight forward and workable. Except for the BGA package. Never heard of a package like that before. I actually retired from electronics 20 years ago. Getting into it again, but there's a lot that passed me by. DIY electronic projects are now difficult with those miniature parts.

I looked into those chips but often the package and com are a PITA, they are expensive, and they have lots of limitations.

BGA stands for ball grid array and is probably the worst package ever, both because it's a PITA for prototyping, etc... and because it has greater chances of having bad solder joints (some uses x-ray to inspect BGA soldering... even if it doesn't solve cracked joints after fab due to product usage and thermal cycles). It exists only because you can have lots of pins in a small area. I wouldn't go past DFN in the PITA packages list personally. Of course it requires hot air or an oven, and it's a one chance package: if you mess-up the assembly you need to use a new chip as it has factory applied solder balls (unless you can re-ball it, but if you have to ask then you don't...).
 
I don't know what's going on with the previous measurements in the RV, but the inside-the-house measurements look much better.
1200minV.jpg

Cell 1 voltage is measured directly as it is referenced to ground. The rest of the cell voltages are calculated as they are not referenced to ground. For Cell 2, the adc measures about 6.6V. V_cell2 is calculated by subtracting V_cell1 from the measured value of ~6.6V. V_cell3 is calculated by subtracting 6.6V from the measured value of ~9.9V. It appears cell 2 measurement needs about 100 minutes to stabilize. I probably need to run the test a couple of days to see if voltages further diverge.

1200minI.jpg

The current measurement looks a lot better. Current scale is to the right. There's a slight thermal effect (which can be corrected).
 
I don't know what's going on with the previous measurements in the RV, but the inside-the-house measurements look much better.

Do you have anything who can be a source of EMI in the RV?


Cell 1 voltage is measured directly as it is referenced to ground. The rest of the cell voltages are calculated as they are not referenced to ground. For Cell 2, the adc measures about 6.6V. V_cell2 is calculated by subtracting V_cell1 from the measured value of ~6.6V. V_cell3 is calculated by subtracting 6.6V from the measured value of ~9.9V.

Shouldn't you substract the other cells voltages instead of 3.3V? I guess it's just for testing, but still, you should get more accurate results.


It appears cell 2 measurement needs about 100 minutes to stabilize. I probably need to run the test a couple of days to see if voltages further diverge.

That's a loooong time for something like that. Tho the question is from what state to what other state are you waiting for things to stabilize?


The current measurement looks a lot better. Current scale is to the right. There's a slight thermal effect (which can be corrected).

Yeah, that's no big deal. You can add some rolling averaging with a really low coef for the new value too if you want a cleaner curve (but you'll slow down the response of course). You can also try some over sampling and averaging if you have spare ADC and MCU time to smooth the jumps given you're down to one LSB here.
 
  • Like
Reactions: Cal
Do you have anything who can be a source of EMI in the RV?
No emi in rv. The batteries were disconnected from the rv. No Chargery bms. My bms was powered from a lab supply. No battery drain.

There's good news and very nice news. The test was repeated with excellent results. My guess is that there was a higher impedance ground connection that was causing the ugly previous plots. Due to a failure, I had to replace the mux and adc and therefore inserted sockets. I worked the mux and adc in and out the socket a few times before testing again. That may have done the trick... Perhaps.

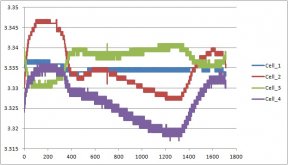
1700minV.jpg
Cell voltage measurements look fairly decent. Looks like there's ~15 mV thermal drift over 16 deg.C span. I should be able to add a thermal correction factor to the cell voltage calculation. Cell voltages were monitored with a Fluke 87 III. All cells remained at 3.330V.

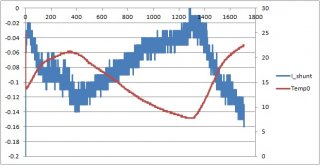
1700minI.jpg

Likewise, current still has some thermal drift. I should be able to improve on this plot.
Time is in minutes. Test took 1700 minutes, or 28 hours. Temperature scale is at the right horizontal axis.

An average of 10 measurements are taken to calculate cell voltages. 20 measurements are taken to calculate current. No running average. The data doesn't move that fast to require that. I probably wasn't clear how I derive cell voltages. The adc measues 4 voltages: Vadc1, Vadc2, Vadc3, Vadc4.

Vcell 1 = Vadc1
Vcell 2 = Vadc2 - Vadc1
Vcell 3 = Vadc3 - Vadc2
Vcell 4 = Vadc4 - Vadc3

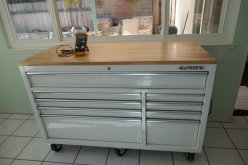
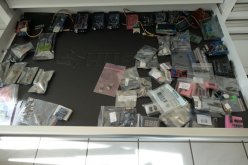
Christmas came early. DW (Dear Wife) took pity on me for constantly looking for parts that were somewhere "hidden" in the house or garage. Electronic projects just started up for me a few years ago. There was no parts storage organization. Until now. Yeah!

P1001505R.jpg


P1001506R.jpg
 
There's good news and very nice news. The test was repeated with excellent results. My guess is that there was a higher impedance ground connection that was causing the ugly previous plots. Due to a failure, I had to replace the mux and adc and therefore inserted sockets. I worked the mux and adc in and out the socket a few times before testing again. That may have done the trick... Perhaps.

Yep, probably a bad contact. I always use tulipe sockets because the other type is far more prone to bad contacts.


Cell voltage measurements look fairly decent. Looks like there's ~15 mV thermal drift over 16 deg.C span. I should be able to add a thermal correction factor to the cell voltage calculation. Cell voltages were monitored with a Fluke 87 III. All cells remained at 3.330V.

1 mV/°C, not bad without correction ;)


Likewise, current still has some thermal drift. I should be able to improve on this plot.

Given how perfectly the curves match each other it should be pretty easy :)


Christmas came early. DW (Dear Wife) took pity on me for constantly looking for parts that were somewhere "hidden" in the house or garage. Electronic projects just started up for me a few years ago. There was no parts storage organization. Until now. Yeah!

That's nice :D
 
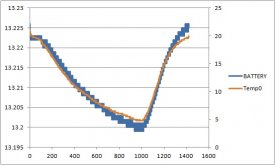
Shunt current temperature drift is in good shape now. Temperature scale is to the right in deg.C. Temperature goes from 20C to 5 and back to 20C in about 1400 minutes (~23 hours). I probably should conduct a 48 hour test to check long term drift.

I_shunt12-2.jpg

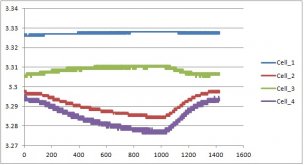
Voltage thermal drift is still a problem. I'm not sure what's going on. Cell 1 has no drift. It reads exactly with Fluke measurements. Temperature is not show on this graph, but would look exactly the other plots where temperature is displayed.

Cell12-12.jpg

Measuring Cell 4 voltage with respect to ground (labeled BATTERY in the plot) has major thermal drift. Voltage drifts 25 mV over a span of 15 degC. All 4 cell voltages are multiplexed into the same adc input. Doesn't seem like the adc is the problem since Cell 1 is OK.

VBat2-12.jpg

Things look ugly when cell voltages are calculated for Cell 2 - 4.

Vcells2-12.jpg
 
Shunt current temperature drift is in good shape now.

Nice :D


Voltage thermal drift is still a problem. I'm not sure what's going on. Cell 1 has no drift. It reads exactly with Fluke measurements.

What's the tempco of your resistors? because I guess they are the culprit, and that also explains why the first one isn't drifting ;)
 
  • Like
Reactions: Cal
My resistors are 1%, metal film.

Even Cell 1 has a resistor divider.

Cell 1: 33k, 33k
Cell 2: 66.6k, 22.2k
Cell 3: 100k, 20k
Cell 4: 133k, 19k

k1 = 0.5
k2 = 0.25
k3 = 0.167
k4 = 0.125

Why shouldn't Cell 1 drift?
 
So let's assume they are 200 ppm/°C max (and that's generous...).

Now imagine one is 200 ppm/°C and the other one is 25 ppm/°C for example. For the 66.6/22.2 divider that means that for 15 °C difference you would have 66.80/22.21 which has a ratio of 0.2495 instead of 0.25. That's a 0.2 % difference which is a 6.6 mV difference for 3.3 V which is right around what your graph is showing.

It also explains why the curve is reversed for cell 3 (the resistor having the higher tempco is the smaller one instead of the bigger one).


Why shouldn't Cell 1 drift?

They are the same value resistors coming from the same batch so their tempco should match pretty well.


Fortunately it's easy to correct in software as it's just a linear gain error ;)
 
My project went off on a tangent. Originally I was going to use an Arduino Nano controller and a touch screen display. That is, until I heard about WiFi access point and the capability of a ESP32. Now I've switched to a ESP32 controller using my iPad as a display via WiFi.

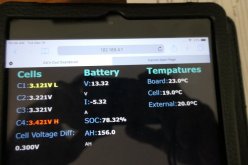
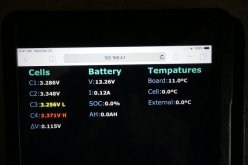
Here's my first shot at creating a web page.

P1001533R.jpg


These values are just static values inserted into the program, as the ESP32 isn't connected to the battery yet. Not sure why the units (V, A and AH) in the second column have their separate line. The lowest cell voltage is highlighted in yellow and the highest in red.

Unfortunately the SDfat library does not support ESP32. That means my data logger routine does not work. I haven't figured out how to log data yet.

I would love to get a x-y graph working to plot AH or current over time. Are there any simple solutions? Help?
 
My project went off on a tangent. Originally I was going to use an Arduino Nano controller and a touch screen display. That is, until I heard about WiFi access point and the capability of a ESP32. Now I've switched to a ESP32 controller using my iPad as a display via WiFi.

Here's my first shot at creating a web page.

View attachment 30347


These values are just static values inserted into the program, as the ESP32 isn't connected to the battery yet. Not sure why the units (V, A and AH) in the second column have their separate line. The lowest cell voltage is highlighted in yellow and the highest in red.

Unfortunately the SDfat library does not support ESP32. That means my data logger routine does not work. I haven't figured out how to log data yet.

I would love to get a x-y graph working to plot AH or current over time. Are there any simple solutions? Help?
Looks like ya found what ya needed. Nice!
 
Not sure why the units (V, A and AH) in the second column have their separate line.

I need to see the code to be able to help on that one ;)


I would love to get a x-y graph working to plot AH or current over time. Are there any simple solutions? Help?

You can use a lib or do you own thing: search for something like: canvas js graph ;)
 
  • Like
Reactions: Cal
I need to see the code to be able to help on that one ;)
Thanks for offering, but I already found the units at the wrong spot. All is good now. ;)

client.println("<div class=\"header\">Battery</div>");
client.println("<div class=\"metric\"><label>V:</label><span>" + String(batteryVoltage, 2) + "V</span></div>");
client.println("<div class=\"metric\"><label>I:</label><span>" + String(batteryCurrent, 2) + "A</span></div>");
client.println("<div class=\"metric\"><label>SOC:</label><span>" + String(batterySOC, 1) + "%</span></div>");
client.println("<div class=\"metric\"><label>AH:</label><span>" + String(batteryAH, 1) + "AH</span></div>");
 
Ok, perfect ;)

NB: I recommend to use single quotes around your strings when you print some HTML so you don't have to escape all the double quotes in it ;)
 
Got the ESP32 fully operational, currently doing data logging.

P1001534R.jpg

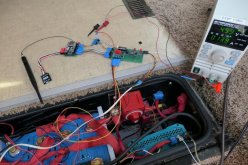
For initial testing I'm using a lab power supply to power the unit with 5V. The lab supply provides load current feedback which is important for initial testing. Load current is 139 mA; 75 mA of which might be associated with WiFi operation.

P1001535R.jpg


The connections (from top going clockwise are:
5V power
shunt connection
4 x cell connection
5V power to ESP32
I2C and mux control lines
Dallas Temperature sensor connection

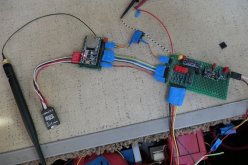
Directly connected to the ESP32 is the SD data logger and WiFi antenna. Power and signals are soldered directly to the SD adapter.

The Dallas temp sensors are very nice. No adc needed as they output a digital signal which can be read in degrees C or F. Each sensor has a unique address. That means you can have as many sensors as you want on the same one-wire bus. Just need 3 wire connections: 3.3V, gnd and data bus. The connector labled "GND" as room for 6 temperature sensors. Currently just the board temp sensor is plugged in.

There's a big red capacitor connected directly to the ESP32 3.3V and gnd pins. The cap is added due to the high current demand when WiFi broadcasting. The caps have some history. I had some sample capacitors from the days when I worked for Bosch back in the '70's. All the caps are are about 45 years old! It's about time they get some action.

P1001536R.jpg

Made some mods to the display. Added the "delta" symbol. Cell voltage measurements still need calibration. Temperature for "Cell" and "External" are shown as zero since their sensors are not connected yet.
 
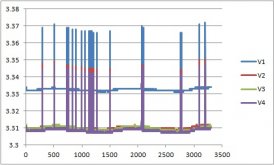
Ran a 55-hour data logging test. I got some interesting results. I'm seeing quite a few noise spikes in the log file.

Error_spikes.jpg

Cell voltages 2, 3 and 4 are virtually on top of each other while cell 1 has a bit higher voltage. The voltage spikes are disturbing. Each cell has a spike at the same time frame. x-axis is time in minutes.

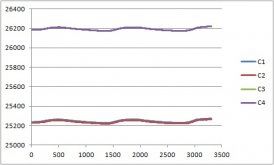
NoError_spikes.jpg

I also log adc output data. No spikes are seen. That means the problem is associated with the ESP32, when converting the adc cell count to a cell voltage. I was using the iPad WiFi to read cell data from time to time while taking the measurements. Can the WiFi connection cause the spikes? That's my theory presently. WiFi does consume a bit of current without the iPad accessing it. Perhaps there's no connection between iPad access and the spikes. Perhaps 3.3V needs better buffering (a larger cap). I had a 0.68 uF cap connected to 3.3V. I'll swap in a larger cap to stabilize 3.3V more.
 
I've added a 100 uF ceramic capacitor to the ESP32 3.3V supply with no improvement. The spike doesn't appear to be voltage related. The current calculation also has spikes at the same time frame. The spikes appear to be associated with iPad WiFi access.

Voltage spikes are in the neighborhood of 30 to 35 mV. The current spike is greater than -6A. As mentioned in my previous post, the adc data is clean. The ESP appears to be making an error in its calculation.

In addition, there's also some drop-outs with temperature measurements. These are unrelated to WiFi access.

The fix might be a data validity test and recalculate if out of bounds.

Error_spikes2.jpgErrorCurSpike.jpgErrorTempSpikes.jpg
 
Back
Top