


Hi, I made some observations that lead me to believe a cell is not aging as fast as the other ones.
Here is the setup: 300 Ah Winston cells (2016) setup as 2P4S (600 Ah 12 volt battery). Cells have sequential serial numbers.
Cells are never charged at more than 3.46 VPC. Float at 13.2V (or charger disconnected)
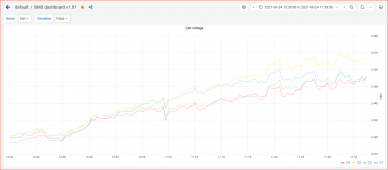
Charge graph (see attached):
this is the end of charge at 13.84 V (3.46 VPC) and charge current is just under 15 A
cells 4 seems to be less charged than cell 3 (120 mV less than cell 3) - edit: read 20mV
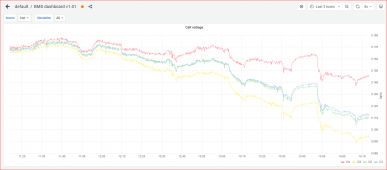
Discharge graph:
SOC is at 19% and current draw is about 15 A
cell 4 seems to have more capacity left than cell 3 (60 mV more than cell 3)
This observation would say that cell 4 has more capacity than the other cells. Has anyone seen similar aging variance?
I would be surprised if it comes from differences in the cells (same manufacturing batch and sequential serial numbers)
Any other suggestions / hypothesis that could explain such variance?
Edit: the cells internal resistances measured by the BMS are:
cell 1 = 0.26 mOhm
cell 2 = 0.29 mOhm
cell 3 = 0.27 mOhm
cell 4 = 0.33 mOhm
These have been stable for the last 6 months (when I started measuring)
Here is the setup: 300 Ah Winston cells (2016) setup as 2P4S (600 Ah 12 volt battery). Cells have sequential serial numbers.
Cells are never charged at more than 3.46 VPC. Float at 13.2V (or charger disconnected)
Charge graph (see attached):
this is the end of charge at 13.84 V (3.46 VPC) and charge current is just under 15 A
cells 4 seems to be less charged than cell 3 (120 mV less than cell 3) - edit: read 20mV
Discharge graph:
SOC is at 19% and current draw is about 15 A
cell 4 seems to have more capacity left than cell 3 (60 mV more than cell 3)
This observation would say that cell 4 has more capacity than the other cells. Has anyone seen similar aging variance?
I would be surprised if it comes from differences in the cells (same manufacturing batch and sequential serial numbers)
Any other suggestions / hypothesis that could explain such variance?
Edit: the cells internal resistances measured by the BMS are:
cell 1 = 0.26 mOhm
cell 2 = 0.29 mOhm
cell 3 = 0.27 mOhm
cell 4 = 0.33 mOhm
These have been stable for the last 6 months (when I started measuring)
Attachments
Last edited: