diy solar

diy solar

DIY BMS design and reflection

I've been trying to follow along, but I'm not certain why all the speed and accuracy are needed.

To determine internal resistance you only need two data points, not 300+ per second.

Measure the current on the entire pack, and simultaneously measure the voltage on each cell. Do this twice for the two data points, and you can determine the cell resistance assuming the two measurements were of different currents.

Further, IR doesn't change wildly. You can do one measurement per day and have plenty of advance warning that a cell, or its connections, needs to be checked further.

Yes, it's not the "ideal" 1kHz AC internal resistance check, but it's a lot more realistic in terms of how much energy a cell is consuming vs storing/discharging. Quite frankly the 1kHz IR measurement doesn't have a lot of value, and is only used because it results in a misleadingly low number that doesn't actually represent energy loss within the cell under real world conditions.

I could be way off base here, perhaps someone can help me understand the difference between a DC IR measurement and the AC measurement everyone seems to believe is the gold standard?
 
I've been trying to follow along, but I'm not certain why all the speed and accuracy are needed.

To determine internal resistance you only need two data points, not 300+ per second.

Two current measurements and two voltage measurements (per cell) would be sufficient for DC.
If taken simultaneously, would be sufficient even with high ripple current.

OP's system has single-channel ADC, so voltage and current measurements are not taken at the same time.
My scope captures show massive ripple of battery current, basically following current of AC sine wave.
Therefore, having just two data points for a point-slope calculation will be all wrong. Need some kind of processing, like max/min, averaging, etc. to get an approximation of what voltage and current values should be use for one "point" in that calculation.

Similarly, cell voltage reading comparison is going to be at two drastically different current draws, so will differ by IR. Where "I" could be zero for one cell, 100A for the other. With multiple samples, interleaved between cells, it should be possible to get better measurements and comparison.
 
If what you are trying to do is determine mean or rms current, rather than recover the AC signal (e.g. to plot it), then I think one can get away with far lower sample frequency and averaging many samples. Sample itself must be a narrow enough time slice. If the waveform is steady-state, e.g repeating rectified sine wave and harmonics for a long time, I think this will work. Think, but haven't tried numerically evaluating it.

Let's say you have a 10 Hz AC signal and you do sub-sampling at 5 Hz, then what will happen is that you'll sample the same part of that signal each time so even with average you'll not have a correct result. The only way I found to avoid that (especially on more real world signals that aren't just a sine) is to add a random delay between each sampling.

I have a potential application where I might want to sample near or even below a fundamental, but accurately determine RMS of a signal with harmonics extending well above. Goal is to achieve 100 ppm or even better accuracy. (much higher frequency than powerline, so very high sample rate isn't available at the number of bits I want.) Oscilloscopes don't have the resolution. Sampling DMM which do are about 100k samples/second. My application would have ADC on PCB as part of an instrument product.

Why not down-convert the signal first ? as it's just a LO + mixer it should not be too complicated or costly.
 
I've been trying to follow along, but I'm not certain why all the speed and accuracy are needed.

Speed isn't really needed for IR but more to have an accurate current measurement as the current can have some ripple from an inverter for example. Again, accuracy doesn't need to be super high for IR but it does for all the other things (especially for coulomb-counting as the error is cumulative each cycle).


To determine internal resistance you only need two data points, not 300+ per second.

Measure the current on the entire pack, and simultaneously measure the voltage on each cell. Do this twice for the two data points, and you can determine the cell resistance assuming the two measurements were of different currents.

Yes, but you need a dual channel ADC, which I don't have in this design. So the only other way is to do sequential measurements of current and voltage, if they are close enough time-wise then there's no problem, but to do that you need an ADC with a decent conversion rate. Even if we're talking dozens and hundreds of sample per second only, there's still the problem of CPU time; in normal usage it will busy doing looots of things and that's partly why I planned to have a proper IR measurement where the CPU will not do a bunch of other things and so can be fast and accurate time-wise. Another reason is that you can control if you do the current measurement first then the voltage one, or the other way around, which is useful to improve accuracy since current will not change much while voltage needs to be sampled as soon as possible after loading the battery (the ideal order for that would then be: Iold, Vold, increase current, Vnew, Inew).


Yes, it's not the "ideal" 1kHz AC internal resistance check, but it's a lot more realistic in terms of how much energy a cell is consuming vs storing/discharging. Quite frankly the 1kHz IR measurement doesn't have a lot of value, and is only used because it results in a misleadingly low number that doesn't actually represent energy loss within the cell under real world conditions.

I think the same, true DC IR measurement is better than an AC one and that's why I don't really care about being able to sample fast enough to use the current ripple to do that. I only care about not aliasing and other similar sampling issues.


I could be way off base here, perhaps someone can help me understand the difference between a DC IR measurement and the AC measurement everyone seems to believe is the gold standard?

I'm not in the everyone then ?
 
hehe, computer graphics has lots of emphasis on supersampling and anti-aliasing filters. thats where i came from before solar, ill try my best :)
 
regarding IR being slow changing...

i want to monitor IR in realtime.

others are free to not :)
 
I could be way off base here, perhaps someone can help me understand the difference between a DC IR measurement and the AC measurement everyone seems to believe is the gold standard?
i think of them as being the same at a fundamental level, but i too could be way off base :)


Direct Current Internal Resistance measurement to me usually means:
At X ampere draw, measure cell voltage.
At Y ampere draw, measure cell voltage.

Where X is sometimes 0 Amps and Y depending on size of battery. Works on big cells if Y is enough.

Alternating Current Internal Resistance measurement to me generally means:
Continuously vary the ampere draw as a sinusoid wave. not over Only two Ampere Flow setpoints, but many points continuously. Reading the voltage the entire time, this accumulates Many More Than Two Datapoints.

However, since many AC IR meters use a small amount of current, they cannot perturb the voltage of larger batteries and this results in inaccurate readings. Fine for small cells.


Hope this helps! And if I made mistake, someone please correct me :)
 
I'm pretty sure the small IR meters (like the YR1035) measure the impedance in reality and then extract the resistance from that.

They are basically simplified RLC meters made to measure only the resistance part.
 
Last edited:
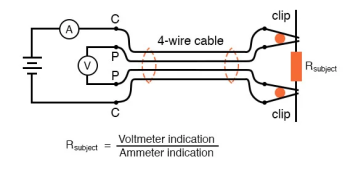
this article helped me a bit to better understand princple of 4 wire resistance measurement (like the YR1035 with Kelvin clip)


Suppose we wished to measure the resistance of some component located a significant distance away from our ohmmeter. but if the connecting wires are very long, and/or the component to be measured has a very low resistance anyway, the measurement error introduced by wire resistance will be substantial.
1643940197939.png
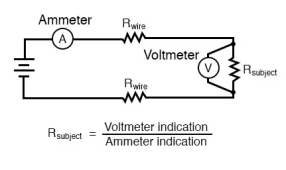
An ingenious method of measuring the subject resistance in a situation like this involves the use of both an ammeter and a voltmeter. We know from Ohm’s Law that resistance is equal to voltage divided by current (R = E/I). Thus, we should be able to determine the resistance of the subject component if we measure the current going through it and the voltage dropped across it:
1643940270178.png
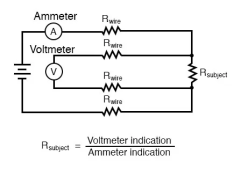
Our goal, though, was to measure this subject resistance from a distance, so our voltmeter must be located somewhere near the ammeter, connected across the subject resistance by another pair of wires containing resistance:
1643940462533.png
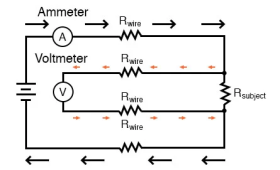
At first, it appears that we have lost any advantage of measuring resistance this way, because the voltmeter now has to measure voltage through a long pair of (resistive) wires, introducing stray resistance back into the measuring circuit again. However, upon closer inspection it is seen that nothing is lost at all, because the voltmeter’s wires carry miniscule current.
1643940507675.png
Any voltage dropped across the main current-carrying wires will not be measured by the voltmeter, and so do not factor into the resistance calculation at all. Measurement accuracy may be improved even further if the voltmeter’s current is kept to a minimum
1643940551345.png
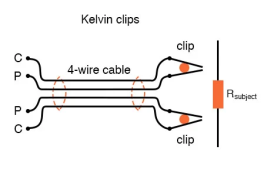
In regular, “alligator” style clips, both halves of the jaw are electrically common to each other, usually joined at the hinge point.
In Kelvin clips, the jaw halves are insulated from each other at the hinge point, only contacting at the tips where they clasp the wire or terminal of the subject being measured. Thus, current through the “C” (“current”) jaw halves does not go through the “P” (“potential,” or voltage) jaw halves, and will not create any error-inducing voltage drop along their length:
1643940605581.png

sorry for the wall :) having so much fun in the weeds!

may this help clarify the principle of operation of AC IR meters with Kelvin clip (4 connection method)
 
Let's say you have a 10 Hz AC signal and you do sub-sampling at 5 Hz, then what will happen is that you'll sample the same part of that signal each time so even with average you'll not have a correct result. The only way I found to avoid that (especially on more real world signals that aren't just a sine) is to add a random delay between each sampling.

Correct, the degenerate case of sampling at same frequency of signal will give some constant, and not what you want. Random timing is your friend.
Similarly random noise lets you average multiple samples to get resolution below ADC raw resolution. Built into DMMs and scopes.

Why not down-convert the signal first ? as it's just a LO + mixer it should not be too complicated or costly.

Don't think that will preserve 100 ppm amplitude accuracy. A mixer is a non-linear device, and while it might maintain relative amplitude of signal, I needed absolute. Plenty of DC instruments down to 1 ppm, but not sure any RF below 1000 ppm.

It seemed like the atomic mass spectrometer itself was the most accurate measure of RF amplitude - if mass of something like N2 appears incorrect, then you know the RF was incorrect. So that approach calibrates the instrument, for several RF amplitudes. Interpolate between. But is it stable enough to not need recalibration? Keeping a reference sample in the chamber which can be heated and evaporated allows periodic recalibration, which is what many systems do. I got about +/-100 ppm over the course of a day. My circuit had an analog gain control loop, oven stabilized.

Another team did an ADC/DAC implementation. That is finally in a product, but I'm not there anymore, don't know how well it performs.
 
Yep, I actually wrote a bit about oversampling + averaging to increase the resolution in a previous post but then I deleted that part since it wasn't really on-topic ^^

Ok, I see. What's the frequency of the fundamental you need to sample?
 
Given the large AC component in your current measurement, you would have to be clever about how to sample and average. Unlike my DC bench measurements where I just averaged over many powerline cycles. For bench RF characterization and calibration (linearization) I filled oscilloscope's 2M memory and computed RMS. But the firmware didn't return as many digits as I think it could have, so I also tried downloading.

The equipment was tuned to run at 11 MHz, more or less.
Objective is to drive variable amplitude signal, controlling it to specified level at 100 ppm stability or better.
Originally, was trying to settle to new amplitude within 100 microseconds, but within a couple milliseconds would be OK.
Dynamic range high to low signal 100:1, 100 ppm of full signal (same voltage resolution for small signal, i.e. 1% was good enough at low end.)
Future product could be 400:1

The key was that time domain waveform peak (including harmonics) isn't important, it is amplitude of the fundamental which matters.
Traditional systems used a diode to sample waveform and fed that into control loop. I used RMS. So my musings have been how to use ADC readings to accomplish the same thing, at lower sample rate rather than needing 14+ bits and > 500 MHz.

Here is a typical DIY or student design, to drive a quadrupole atomic mass spectrometer. Note one coil drives base of transistors to self-oscillate, and an extra one in the full schematic is rectified to measure amplitude and adjust gain.


RF and DC to four rods filters ions based on charge/mass ratio


Of course, I said, "Not Invented Here!" and tried to do it my own way, to achieve better regulation.
 
interesting! thanks for the links to read

regarding AC inverting, it seems 50 Hz or 60 Hz are the most common for gridline stuff

i've dealt with sinusoidal error in time series ADC before by characterizing the error component as sinusoidal by visualizing, finding the frequency, then averaging integer number of cycles to null the partial cycle averaging error

but that time, i used a fixed number of samples, so if the frequency of it changed, error would immediately creep back into the averaged value output

however, it would be nice for user to not need to set 50/60 Hz mode for such a feature to operate

a buffer of say 6 cycles of 60 Hz would be 0.1 second, at 300 Hz sampling, that's only 30 samples to hold in memory

5 cycles of 50 Hz would be 0.1 second, at 300 Hz sampling, 30 samples

to calculate average value, i would maybe go backwards from the start of the buffer of samples and find the local min and max to easily mark the cycle peaks and valleys. then average over a configurable number of AC cycles. this ought to handle 50/60 Hz aliasing decently.

fitting a sinusoid to the same data might provide higher quality output, but it's heavier than minmax cycle detect (at least the algorithm im aware of)

my dream ideal would be that the number of detected cycles to average would be determined or matched by the BMS data refresh rate, e.g. if reporting values at 1 Hz output, keep minimum 1 second of ADC sample buffer and calculate over the entire buffer each time. this ought to remove a lot of error resulting from subsampling

this thread is super neat ☺️?
 
To determine internal resistance you only need two data points, not 300+ per second.
true!

2 good data points can yield an Internal Resistance measurement

however, another aspect to this application is, when inverting to AC, variation in the current and voltage in time over each individual AC inversion cycle, leading to systematic errors in the reported current and voltage readings.

the latter is a bigger motivation for 300 Hz + sampling, than a hypothetical desire to have an Internal Resistance measurement with N=300 instead of N=2. not that i would complain ;)

sample fast to to avoid being bit by subsampling error, making it all the more easy to generate those two data points

for stable DC only load conditions this is much less important imo. if it were a resistor then doing fast sampling doubtful to noticeably improve output maybe.

hope this helps clarify rationale for high sampling rates :)
 
fitting a sinusoid to the same data might provide higher quality output, but it's heavier than minmax cycle detect (at least the algorithm im aware of)

Something like performing FFT, but only need to do that for my one target frequency component. 11 MHz (or whatever exact value) in my case. With sample window spanning a number of cycles, accuracy is improved. FFT can only find frequencies whos period is an integral fraction of sample window (otherwise it attempts to reproduce even a pure tone of single sine wave by adding together many other sine waves.) In my application, quite high sample rate needed to reject the (correlate) harmonics. If uncorrelated random noise or frequencies not associated with the fundamental, then modest sample rate but many cycles would do the trick. But my issue was harmonics.

For BMS, goal is to determine mean average of actual current, at least when tracking SoC, and not amplitude of frequency components.
Also, power delivered is that current times a (relatively constant) voltage, different from an AC power meter, where out of phase current is one of the things affecting power factor.

For cell IR, data points from multiple instantaneous current levels, rather than mean, would allow the point-slope to be calculated even during times of steady power draw (assuming AC inverter, not resistive DC load.)
 
however, another aspect to this application is, when inverting to AC, variation in the current and voltage in time over each individual AC inversion cycle, leading to systematic errors in the reported current and voltage readings.

Absolutely - if you're coulomb counting then you need either fast sampling, or analog integration before digital sampling.
 
True - analog integration cheaply gives far higher frequency response (or filtering, in this case). Hardware Designers Rule!

For a BMS, one ADC channel reading unfiltered current shut output could allow cell IR calculation, while another qualified through RC filters would be better for SoC.

One circuit at work I've simulated (but not prototyped) is a linear post-regulator following a switcher. Couple stages of RC filter attenuate 60 Hz ripple close to 60 dB, creating a tracking reference voltage for my LDO design.
 
Given the large AC component in your current measurement, you would have to be clever about how to sample and average. Unlike my DC bench measurements where I just averaged over many powerline cycles. For bench RF characterization and calibration (linearization) I filled oscilloscope's 2M memory and computed RMS. But the firmware didn't return as many digits as I think it could have, so I also tried downloading.

The equipment was tuned to run at 11 MHz, more or less.
Objective is to drive variable amplitude signal, controlling it to specified level at 100 ppm stability or better.
Originally, was trying to settle to new amplitude within 100 microseconds, but within a couple milliseconds would be OK.
Dynamic range high to low signal 100:1, 100 ppm of full signal (same voltage resolution for small signal, i.e. 1% was good enough at low end.)
Future product could be 400:1

The key was that time domain waveform peak (including harmonics) isn't important, it is amplitude of the fundamental which matters.
Traditional systems used a diode to sample waveform and fed that into control loop. I used RMS. So my musings have been how to use ADC readings to accomplish the same thing, at lower sample rate rather than needing 14+ bits and > 500 MHz.

Here is a typical DIY or student design, to drive a quadrupole atomic mass spectrometer. Note one coil drives base of transistors to self-oscillate, and an extra one in the full schematic is rectified to measure amplitude and adjust gain.


RF and DC to four rods filters ions based on charge/mass ratio


Of course, I said, "Not Invented Here!" and tried to do it my own way, to achieve better regulation.

Well, if price isn't a big problem then you can find ADCs that fit the constraints.

But what's wrong with having some conditionning of the signal in HW? like why do you want to sample the raw signal when it's clearly quite hard to do that?
 
For cell IR, data points from multiple instantaneous current levels, rather than mean, would allow the point-slope to be calculated even during times of steady power draw (assuming AC inverter, not resistive DC load.)

??
yes!
 
Back
Top