diy solar

diy solar

DIY Home Energy Monitoring

svetz

Works in theory! Practice? That's something else
Joined
Sep 20, 2019
Messages
7,273
Location
Key Largo
I recently picked up some CTs and they're now collecting dust.

The only thing I can think of to do with them is a DIY energy monitor, similar to the IotaWatt (check out @MurphyGuy 's post for a fabulous installation and information on it). The IotaWatt is typically favored over similar products like the Emporia Vue (data isn't local) or the Sense (which @FilterGuy says is okay). The Energy Detective (TED) seems to be a cross between the Iotawatt and Sense. There are also two other products I've heard about: the GEM monitor and the RIO.

All of those products are somewhat pricey and I don't think I really need one as I can use my 120V watt meter or clamp meter to get very accurate readings. Although, it might be interesting to see how much energy my ancient F22 air conditioner is using to see if it would be better to replace it. It would also take two CTs, one for the air handler and one for the compressor/condenser. Given the lower operating pressures than modern refrigerants, it might be cheaper.

Costs
It's about $200 for the base IotaWatt unit which supports 14 CTs, comes with a power supply, and two 200 amp CTs. Additional CTs are $9.10. I've two load centers with about 20-25 circuits each, so monitoring everything would be very pricey. You probably don't need to monitor everything though. To just get two circuits I could get the base kit and two 50 amp CTs for $180.

Assuming I actually do anything with this, I'll initially try to use junk laying around the house, so essentially free. But, the component prices look cheap:

ESP32: $5-8 (these have WiFi built in and the ESP32-S2-DevKitC-1 has 20 ADC pins)
CT: I picked up some 120A CTs for $4 from Amazon, but you can find them elsewhere. They're overkill for the circuits I'll measure.

So, monitoring 50 channels would be < $100.

But there are other parts that would be needed, e.g., twisted pair wire to carry the CT output back to the chip, some resistors, diodes, and capacitors. Fancy connectors like the IotaWatt would be nice too.

It would probably be cheaper to use a multiplexer than to buy caps, diodes, and resisters for each of the channels, but you also couldn't tune per circuit, although if numerous circuits all have the same characteristics, you wouldn't need to tune.

As I only have two CTs I'll probably skip the multiplexer. Unless it works really well and I find the information valuable enough to part with more $$$ I doubt I buy more CTs or do anything else with it.

Accuracy
Starting here, I've got a few test runs on the CTs. With tuning, it seems it can be revenue grade. As I'm only planning on monitoring the old AC, I don't have to worry about fancy tuning for low-wattage devices.

Next Steps
The next step is to see if the ESP can reliably transmit wirelessly from the load centers. I've two load centers, one is in a living area so would need to be inside the load center to hide it from sight. As the load center is metal it might be shielded enough to kill the idea. The downstairs one is in a closet so can be outside the load center, but the router is upstairs and some distance away, the signal will have to penetrate inches of concrete with rebar. So I'll have to dig into the treasure horde and find an MCU collecting dust, then code it up to transmit test data and hopefully signal strength.

Any thoughts?
 
Last edited:

Failure to Communicate​

TL;DR: Didn't work.

Wrote a simple Java server on the PC to listen.
Java:
import java.io.*;
import java.net.*;

public class JServer {
    public static void main(String[] args) throws Exception {
        int portNumber = 32;
        System.out.println("Local IP is: "+ InetAddress. getLocalHost().toString());

        try (
                ServerSocket serverSocket = new ServerSocket(portNumber);
                Socket clientSocket = serverSocket.accept();
                PrintWriter out = new PrintWriter(clientSocket.getOutputStream(), true);
                BufferedReader in = new BufferedReader(new InputStreamReader(clientSocket.getInputStream()));
            )
        {
            System.out.println(clientSocket.getRemoteSocketAddress().toString());
            Thread.sleep(5000);
            System.out.println("Well hello there!");
            out.println("Well hello there!");
            out.flush();
     
            String inputLine;
            while ((inputLine = in.readLine()) != null) {
                System.out.println(inputLine);
                System.out.flush();
            }
        }
    }
}

For the Client code I just used the Single Station example code and to get the signal strength added:
C:
    wifi_ap_record_t ap_info;
    esp_err_t err = esp_wifi_sta_get_ap_info(&ap_info);
And then send ap_info.rssi back to the server. Up close and personal it worked fine:
Code:
Well hello there!
Hello There from the ESP32!
Signal strength =  -75

Unfortunately, there was nothing received with the ESP 32 at either load center. I believe there's a wifi power setting and an external antenna might help. So, it might still work.

Update: The power setting command is esp_wifi_set_max_tx_power, but the default is the maximum power, so no joy there.
 
Last edited:
Sorry I can't help but I do have a box of TED stuff including CT's that if you have any use for I'll be glad to donate to your research.
 
Sorry I can't help but I do have a box of TED stuff including CT's that if you have any use for I'll be glad to donate to your research.
Wow! Appreciate the kindness but I'm just having fun messing around with stuff.
Hold onto it, maybe if I get some shocking (electroboom style ; -) videos it'll encourage you to break it out of the box.
 
I suppose it depends what you are trying to do with the information.

The first thing I did when originally planning to go off grid was a complete energy audit of every single appliance I owned. I bought a couple of those cheap e-bay watt meters. They are a multi function device, but most usefully, a display of volts, amps, and instantaneous watts, as well as a cumulative watt hour reading. It also has a peak hold feature for max surge current.

This is not the exact wattmeter I bought (it was several years ago) but this is a similar type of thing:
https://www.ebay.com.au/itm/2660694...W4Twcd+LYe9Sl0fcY+ladRZDCL|tkp:Bk9SR5Tw66XVYQ

The information gathered was very interesting, and by making a few changes, I was able to cut my daily power consumption by about half, without making any life style changes.
 
The first thing I did when originally planning ... was a complete energy audit of every single appliance I owned.
I did the same thing and used the clamp meter on the circuits in the loadcenter. I also recorded the inrush of the big devices (although some (like the ac) were slow or staged and couldn't get a true reading with my cheap meter). Hmmm, perhaps this should be an annual event?

Even so, it's just a snapshot in time so I can see the attraction of continuously monitoring to see if there are changes as it tells you about anything abnormal and the health of a device (e.g. mechanical devices should increase consumption over time as they wear out) and a quick look before you go to bed would let you know which devices the family accidentally left on.

... I was able to cut my daily power consumption by about half, without making any life style changes....
Impressive! I wasn't able to eliminate much. Just found a few incandescent light bulbs and typically they'd have only been on a few minutes per day. The biggest was the "TV/Entertainment center" which got an on/off extension cord as it the total standby draw was around 70W ($85/year savings!). Should probably put it on a timer, everyone remembers to turn it on, but it's rare anyone remembers to turn it off.
 
The whole energy audit exercise was a real eye opener. Just a very few examples:

I had two mains synchronous wall clocks. simple things I have had for years.
Each drew a measured continuous 14 watts.
Now 28 continuous watts does not sound like much but its 28 x 24 = .672 Kwh every single day.
Those went straight into the wheelie bin, replaced with battery powered wall clocks that will run for at least a year on a single AA battery.

Out in the garage I have a radio controlled garage door opener. This uses a 24v dc motor, powered from a fairly large transformer/rectifier.
This transformer always ran pretty warm and was continuously powered consuming 38 watts of idling power.
It also supplied twelve volts to the radio receiver which needed to be continuously powered.
I modified the whole thing to use a small "transformerless" wall pack to power just the radio receiver. The radio receiver operated a relay, and I re arranged things so that a second relay connected power to the big transformer only when the motor needed to run. That eliminated another .912Kwh.

A lot of incandescent and fluorescent lights were replaced with LED lights.
I found that the real energy hogs were the smaller things that ran 24 hours a day. Big loads like kitchen appliances and power tools may draw kilowatts, but only for a very few minutes at a time while actually being used.
Not much can be done there, but amazingly its not those that suck most of the total power.

I did replace a couple of power hungry appliances that ran continuously with more modern low energy equivalents. I was due for a new refrigerator anyway, and a LED flat screen computer monitor replaced my big old CRT monitor (this was all quite a few years back).

All simple changes that dramatically reduced the total daily mains power consumption without having any effect on lifestyle.
Absolutely no need to live like a monk !

A complete energy audit will tell you what is what, and with a bit of cunning and ingenuity its possible to make huge reductions in daily consumption.
 

Now we're talkin!

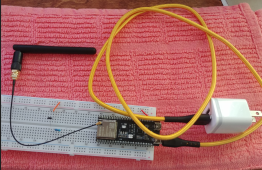
Without an antenna the ESP on my desk has an RSSI of -66.
With a 2.4 GHz 3 dB antenna as shown to the right at the desk it's -20.

So, there's probably not even a printed antenna on the board,
at least I don't see one (could be underneath).

At the upstairs load center: -79
At the downstairs load center -55

snoopy-happy-dance.gif
1678126730487.png
 
Last edited:

Circuit Design​

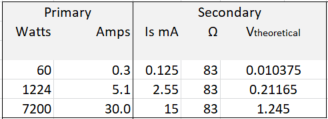
Measuring the F22 Air Conditioner with the clamp meter shows 5.1 amps (1224W) on one circuit and 1.41 amps 340(W) on the other. Not sure what the startup surge is, let's guess 30 amps.

Therefore, the CT should be turned for 5-30 amps. We know from the prior experiments that the CT is close to the theoretical if kept under saturation, so we need a burden resistor to limit the voltage to 1.25V at the max current of 30 amps. Is = 30 amps / 2000 turns * 1000 mA/amps = 15 mA. V=IR, so 1.25/.015 = 83Ω, so the burden resistor needs to be under 83Ω. If the ESP can measure accurately to 100th of a volt, the accuracy is +/- 60W.

1678200830240.png

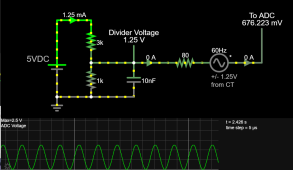
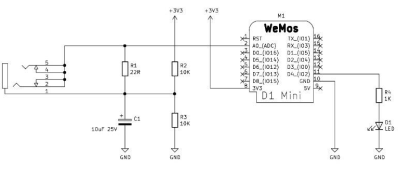
The CT is generating an AC current which with an 83Ω burden resistor should be between -1.25 and 1.25V; which needs to be converted to positive DC. You could use diodes, but they're going to have a voltage drop.

So why not use a voltage divider on the input 5V to offset the AC by 1.25VDC? Then the final AC voltage would vary from 0 to 2.5V, which just happens to be the range of the ESPs ADC. There is a DAC on the ESP which could generate the 1.25V rather than a voltage divider, but I doubt you could use it for this.

So for the circuit? Toss in a 10 nF capacitor to smooth the reading?
1678200112887.png
 
Last edited:
If I were programming an ADC to get a DC voltage, I'd get a dozen readings, toss any outside the standard deviation, and then average the result.

But AC is a moving target, the voltage isn't steady over time.

Maybe it's not so bad, given a timestamp and the frequency 3 points is enough to fit a curve. How do you determine how far off the points are from a standard deviation?

In the image above, the sine wave is linear. If you've ever played with a spirograph, you'll recognize that as a point on a traveling circle:
ezgif-1-b464a676e8.gif
So, all of the sample points can be constrained to fit a circle where the radius equals the maximum voltage. So, we should be able to get the standard deviation of all the points and then proceed as you would for DC. That sounds simple enough in theory ; -).

But suppose the constantly changing voltage affects the accuracy of the ADC? I wonder if there's some circuit design trick to turn the AC into DC.
This has probably been solved a million times... need to do some googling to see what others have done.
 
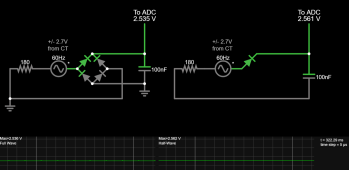
If you use the diodes with a full bridge or half bridge rectification and a big enough cap you can get a steady DC current (note the burden resistor size was increased to account for the voltage drop across the diode):

1678212421445.png
With 100 nF it takes about 3 ms for the voltage to stabilize from 0 to 2.7, but a couple of seconds for it to drain (e.g. 2.7 to 0V). Another downside to the diode is the voltage drop eliminates low voltage readings (although that's not important for measuring these two circuits).
 
Last edited:
There are chips (e.g., AD737, $6) that will convert the AC voltage to DC, internally they seem to use full wave rectifiers, but the datasheets show they go down to ~1mV.
 
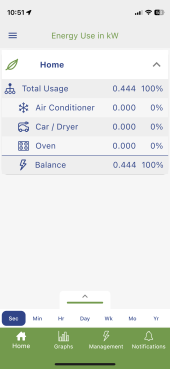
I installed this in my electrical box last year. Cost $125. https://www.amazon.com/gp/product/B08G37ML2R/
It's the Emporia smart home energy monitor. You can use clamps to monitor however many circuits you want. I only used three, mainly because I don't know which circuit goes where in my house.
Attached is a picture of my current usage from the app.
 

Attachments

  • IMG_1640.PNG
    IMG_1640.PNG
    270.8 KB · Views: 3
I installed this in my electrical box last year. Cost $125. https://www.amazon.com/gp/product/B08G37ML2R/
Thanks! As you can see from the OP there's a wide variety of models out there.

.. I only used three, mainly because I don't know which circuit goes where in my house.
There are a number of inexpensive circuit tracers to help with this. For circuit breakers, I usually just flip one off and walk around trying to figure out what's what. If I can't figure it out, I leave it off until someone complains something isn't working (some have been off for years). ; -)
I do have a wire tracer for finding wires buried or in the walls, really hate drilling through wires. See also #10 in Why didn't I think of that?
 

A much simpler way to do this, not that it will keep me from doing it the hard way ; -)
 
In the video above they used the Mottramlabs lab sub-board which has
4 resistors and a capacitor and they're kind enough to provide the circuit.

Looks like they use the voltage divider to create an offset voltage and
feed the output directly to the ADC, seems identical to #9, so there
probably isn't a concern about the varying voltage on the ADC affecting
accuracy. Have to see how they got the maximum voltage.
1678280465432.png
It also occurred to me that while current transformers are one thing, Items marketed as CTs might not actually be current transformers. See this post for more on that.

Update: They don't seem to do anything to pick up the maximum voltage, possible the built-in capacitor on A0 is holding the high value as was learned in #11? Could also be built into the library they were using.
 
Last edited:

Single circuit WiFi Monitoring - $17​


Saw this, no clue if or how well it works, but probably cheaper than what I'm working on to monitor a single circuit.
 
Last edited:
I recently added Iotawatt to my system to monitor my inverter output. I have 2 inverters and monitor closely the load balance on each leg + total output. In winter I only use 1 inverter to keep load higher for better efficiency but in summer I need both inverters to be able to consume all the PV.

What I really like:
1) Its simple, local wifi and has data upload options such as to remote or a local InfluxDB. No need to share data in the cloud but can if you want.
2) It has a Query API so I don't even need InfluxDB or any uploads - I just pull the data directly to my DIY monitoring
1678386479576.png
3) Pretty simple to setup / I don't need things to be complicated. Did a 48v -> USB to power it from the powerwall.


Accuracy. The iotawatt replaces my camera system pointing to cheap power rmeters and is reporting about 2% higher kwhs than the meters below.
1678386534774.png
this is good enough for me, but not sure which is more accurate.

Query API Example: Pulling data for Inverter #2 - volt ref, leg1 watts, leg2 watts - over a date range. There are query limits but a loop, pulling in chunks takes care of that. Iotawatt records data in 5 sec intervals.
--------------------------------------------------
2023-01-28T12:59:10, 114.8, 401.8, 1042.3
2023-01-28T12:59:15, 114.8, 409.6, 1060.7
2023-01-28T12:59:20, 114.6, 459.5, 1043.8
2023-01-28T12:59:25, 116.1, 521.3, 1091.3
2023-01-28T12:59:30, 116.8, 368.6, 1066.9
2023-01-28T12:59:35, 116.8, 367.3, 1039.9
2023-01-28T12:59:40, 116.9, 369.1, 1038.9
2023-01-28T12:59:45, 116.9, 395.1, 1050.2
.....
 
Last edited:

Math​

Since we're not trying to do things the simple way, let's dive into the math...

Knowing it's a sine wave means Vmeasured = Vmax sin(α). We also know the timestamp of each measurement, so our measured data consists of v1@t1, v2@t2, and so on. So let's say our datapoints are:

0.866V @ 2.778 ms
-0.34V @ 9.26 ms

V1 = Vmax sin(αT1)
V2 = Vmax sin(αT2)

Combining the equations we can remove Vmax and get V1 / sin(αT1) = V2 / sin(αT2)

We also know the frequency is about 60 hz in the U.S., so every 1/60th of a second is one full cycle.

ΔT = 6.48 ms or 6.48 x 360°/16.6 ms = 140°, so αT2 = αT1 + 140°, so now we can solve for αT2 knowing sin(a+b) = sin(a)cos(b)+sin(b)cos(a), which can give us Vmax.

Except that in the data, the voltages are questionable, so we'd want to take several samples and use them to calculate a Vmax, then average those together throwing away any points beyond a standard deviation. If we used polar coordinates, the distance from the center would always be Vmax. So, that might make it easier to use figure out which points were bad data.
 
Last edited:
Something something using two or more points sampled within one cycle to solve for the phase angle, then comparing the observed voltages against sin(αcalculated) using timestamps, the measured voltages should fall slightly above or below the sine function. collect some data, characterize the range of difference between the inferred AC waveform from computed phase and the measured voltage, and then reject data that is >2/3rd of the highest error?

this thread is making me want to write firmware. it's fun to know what's going on in the box.

to do it pretty accurately in DIY, one mainly needs a CT sensor per branch to detect current and at least one voltage meter for the hot leg voltage?

neat thread!
 
Back
Top