svetz
Works in theory! Practice? That's something else
A No-Math solution is the advantage of the half or full bridge rectifier circuit in #11. But diodes with low voltage drops cost around a quarter and capacitors around a nickel! Actually, the half-bridge circuit has one less component, so possibly cheaper, but you have to put up with the slow drain (or add a bleeder resistor controlled by a switching transistor?).this thread is making me want to write firmware. it's fun to know what's going on in the box.
Depends on what "pretty" means. For example, if you assume 120V when pulling 10 amps that's 1200 watts. But if you measure it at 122V that's 1220 watts, or an accuracy of 1.7%.to do it pretty accurately in DIY,
CTs are outputting very small voltage changes for current changes, most have a 1V range. For most commercial applications you'll have to tune your CTs for the entire range (e.g., 0-200 amps, 0-100 amps, or 0-50 amps). That is, 1V covers the entire range, so the larger the range the smaller the voltage change and the lower the accuracy. So a 50 amp CT might not register an LED light coming on, the voltage change of the CT falls into the noise range.
With DIY, you can get far more accurate by tuning to cover the range you're interested in. For example to monitor my air conditioner the clamp meter shows 5.1 amps (1224W) on one circuit and 1.41 amps 340(W) on the other. Nothing else is on the circuit so I don't have to worry about low-watt LED lights or someone plugging in a vacuum (although you do have to worry the inrush amps won't fry your chips).
Let's take a wall outlet that normally has up to 100 watts of power (e.g., your cable modem and stereo), but someone might plug a vacuum cleaner into it for 5 minutes. Let's say that since the vacuum is run for 5 minutes every couple of days, you don't care about the accuracy when it's on. What you really want to measure is 24x7 of the sub-100-watt loads. In this case, you need to use the breaker size plus the suspected in-rush to not fry the chip with high voltages. With an ESP32c readings over 2.5V on the ADC won't be as accurate, but the pin can safely go up to 3.3V. So, you can pick a high-burden resistor giving you a greater voltage range. The readings won't be very accurate while the vacuum is on since the voltage range would be where the ADC isn't as accurate, but the rest of the time you'd be able to pick up what otherwise might be noise. You can also play other games, like using a 5V 32-bit ADC chip that communicates back to the MCU (the saturation on the CTs I experimented with was 4 V, but going over saturation just means a drastic reduction in accuracy which isn't important if that range is the inrush current).
Finally, components have "tolerances", so you very rarely find a 50Ω resistor that actually measures 50Ω. But in a DIY circuit, you can measure and plug in the actual value. Although, it wouldn't be hard for the software of any commercial unit to use calibration to overcome this problem which they could do in the factory.
So, unless the ADC is really bad or something is injecting a lot of noise; DIY should offer more opportunities than commercial systems for accuracy.
If you don't care about the power direction (e.g., I don't have to worry about my Air Conditioner suddenly generating power ; -) then you just need one CT to get amps. If you want power (watts) you need the voltage (which you could get from your existing solar API). If you want power direction, then you also need to know the grid phase and calculate the CT phase.one ...needs a CT sensor per branch to detect current and at least one voltage meter for the hot leg voltage?
PowerStrip: Another Fun Project?
Doesn't have to be a circuit branch. For example, let's go back to the idea of measuring very finely all the devices in an entertainment center rather than one lump sum for them all (that way you can see if one is a hog and needs to go. After all, every 10W is generally > $13/y)....needs a CT sensor per branch...
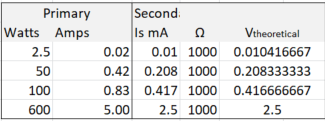
| You could build the equivalent of a power strip where each socket reported its current draw. Add a 5 amp breaker, just in case the kids plug the vacuum cleaner into it. Now you can tune the circuit for a maximum of 600W, getting a 2.5W sensitivity with an ADC accuracy of 0.01V (Some of the ADCs supposedly can measure accurately to nV, and quite possibly the ESP's ADC is better than 10 mV). Or, go crazy with a 3 amp breaker for a 1.2W accuracy (10 mA). |
Last edited:


