diy solar

diy solar

help me understand inverter measurements

guzman_goav

New Member
Joined
Mar 20, 2022
Messages
8
i am getting the following measurements in my inverter which i can use in grafana. i need help understanding what they mean because they are apparently all the same

mains voltage

AC OUTPUT power

ac_output load

AC_OUTPUT voltage

PV_PERFORMANCE
PV_ VOlt
PV _ Ampere

watt-hours total today


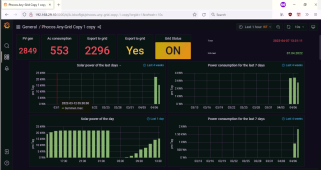
the inverter is a phocos any-grid and i just want to replicate at first the same dashboard their bluetooth app provides,

solar generation,

energy usage,

energy consumed from grid

export to grid
 
What is your datasource type in Grafana that stores your metrics data?
- Prometheus TSDB
- Elasticsearch
- MySQL
- ?

The queries to get the values you are looking for will use the native language of the datasource type.
 
i saw that dashboard, its too many parameters i can handle.... i did figure out something since i posted this.


so the PV generation, AC consumption and export to grid i figured out by cross checking the app and the measurements from various parameters....

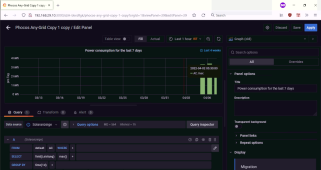
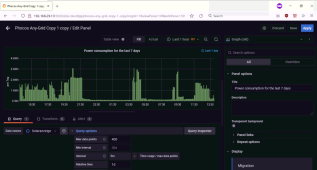
there is stuff i need to understand, like i need to get a "total" of the AC consumption. right now i am trying stuff and getting ridiculous values like 51.5K for that.

like the "power consumption for the last 7 days". do i need to put "max" or "mean" or "sum" ? is this correct to say for these three days my consumption was around 3~4 kw/h for 24 hours?

or is this how much energy do i take from grid AND solar ? or from solar only?

also, the "export to grid" figure is a simple PV less AC consumption. if this is negative, that means i am drawing from grid so if i wanted to plot this, i would need a way to put positive figures above a baseline and negative below? is there a graph in grafana that does that?


Screenshot_20220407_135528.png

1649320388789.pngScreenshot_20220407_135325.png
 
Back
Top