diy solar

diy solar

How to create SOC vs OCV chart for LFP cell ?

linuxnewbie

New Member
Joined
Jun 14, 2021
Messages
34
Hi team members

I am interested in knowing how to create my own SOC vs OCV chart for an LFP cell type, here's what I have done previously

1- Performed capacity test and make this cap a fixed value to be discharged/charged in small increments wrt to percentages of SOC
2- in my case I choose 3500mAH as my base capacity and then I discharged 1% from beginning and end-stage and 5% in the middle since voltages basically flat
3- for every percentage of chg/dchg I gave a cell resting time of some hours and finally got my plot

my doubt here is that even tho my cell was charged to 3.65V but I started the test after some hours and then my cell voltage started at 3.3-3.4V something, here how can I define my 100% soc when my cell never began from 3.65V?

here's my battery spec sheet, if anyone is interested in the cell data
 

Attachments

  • Technical-Specifications-HTCFR26650-3400mAh-3_2V-EN.pdf
    1.3 MB · Views: 36
Save your self trouble and time and just get a shunt to monitor the state of charge. Plug it in, enter settings and you are done.
 
You noted that after charging to 3.65 volts, after some settling the voltage dropped to 3.3V. To some extent, this happens not only at full charge, but at all states of charge. If you charge a bit the voltage increases, then settles down. If you discharge, the voltage will sag, then recover. This is also true of Lead Acid batteries.

What is different is that because the curve is so flat on LFP, these small changes in voltage result in huge errors in determining SOC by voltage. For Lead Acid errors would be much smaller (but even then not insignificant). You also noted that you let the batteries rest before recording each voltage. It is realistic that you would be letting the voltage rest while the batteries are in actual use? You can go through this exercise, but in the end, your results will not be meaningful.

The only accurate way to know SOC is with a shunt-type SOC meter.
 
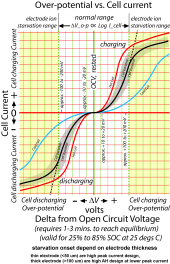
When a LFP cell is fully charged up to 3.65v with charge current tapering off to low levels, overpotential charge voltage is traded for surface capacitance charge. For LFP cell, the capacity stored in this surface charge capacitance is small, only amounting to about 0.01% of cell's AH rating. Most of this surface charge happens in the anode graphite layer. It is similar to a supercap.

Left in unloaded open circuit state this surface capacitance charge can take a few days to bleed off on its own. You can bleed most of it off with an external load resistor in about a minute.

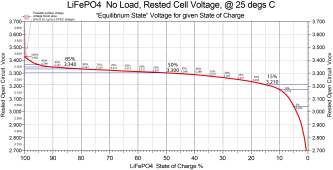
Once this surface charge is discharged the open circuit terminal voltage will be about 3.45v for a fully charged LFP cell.

To do a graph of open circuit voltage vs state of charge you need to understand overpotential. For an LFP cell it takes a minute or two after a cell current demand change for terminal voltage to reach equilibrium. It has an exponential time decay to the new equilibrium before it approaches steady terminal voltage for given cell current (discharge current has slump in open circuit terminal voltage, charge current rises terminal voltage). The time decay and amount of overpotential voltage is greater near full state of charge and at the bottom 15% state of charge.

You also need a fairly accurate voltmeter. Better than a few mV of accuracy.

At a given state of charge you have to be sure you wait enough time, at zero cell current, for the open circuit equilibrium terminal voltage to be reached. Overpotential voltage versus cell current is temperature dependent. Rested OCV LFP terminal voltage is not very temperature dependant.

LFP Over-potential Chart.png

LiFePO4 Cell no load voltage.png
 
Last edited:
Temperature, load, whether you are charging or discharging, or just came off charging or discharging, all make using voltage useless. Get a shunt.
 
When a LFP cell is fully charged up to 3.65v with charge current tapering off to low levels, overpotential charge voltage is traded for surface capacitance charge. For LFP cell, the capacity stored in this surface charge capacitance is small, only amounting to about 0.01% of cell's AH rating. Most of this surface charge happens in the anode graphite layer. It is similar to a supercap.

Left in unloaded open circuit state this surface capacitance charge can take a few days to bleed off on its own. You can bleed most of it off with an external load resistor in about a minute.

Once this surface charge is discharged the open circuit terminal voltage will be about 3.45v for a fully charged LFP cell.

To do a graph of open circuit voltage vs state of charge you need to understand overpotential. For an LFP cell it takes a minute or two after a cell current demand change for terminal voltage to reach equilibrium. It has an exponential time decay to the new equilibrium before it approaches steady terminal voltage for given cell current (discharge current has slump in open circuit terminal voltage, charge current rises terminal voltage). The time decay and amount of overpotential voltage is greater near full state of charge and at the bottom 15% state of charge.

You also need a fairly accurate voltmeter. Better than a few mV of accuracy.

At a given state of charge you have to be sure you wait enough time, at zero cell current, for the open circuit equilibrium terminal voltage to be reached. Overpotential voltage versus cell current is temperature dependent. Rested OCV LFP terminal voltage is not very temperature dependant.

View attachment 67876

View attachment 67877
thank you for detailed explanation, and I really liked the two attachments, specially the last one you posted with OCV vs SOC. now can you suggest to me how should I go with my OCV vs SOC test so as to get an accurate and sensible graph like yours?
If you read my steps already you can rectify where I am doing wrong. it will be awesome :)
 
You noted that after charging to 3.65 volts, after some settling the voltage dropped to 3.3V. To some extent, this happens not only at full charge, but at all states of charge. If you charge a bit the voltage increases, then settles down. If you discharge, the voltage will sag, then recover. This is also true of Lead Acid batteries.

What is different is that because the curve is so flat on LFP, these small changes in voltage result in huge errors in determining SOC by voltage. For Lead Acid errors would be much smaller (but even then not insignificant). You also noted that you let the batteries rest before recording each voltage. It is realistic that you would be letting the voltage rest while the batteries are in actual use? You can go through this exercise, but in the end, your results will not be meaningful.

The only accurate way to know SOC is with a shunt-type SOC meter.
alright after getting a shunt-type meter what next? how should I create ocv vs soc plot ? if I do based on capacity approach which is also what I am after then ocv vs soc will be meaningless right? a
better way would be to create a Capacity discharged vs SOC table?
 
A battery supplies electrons/current and can only supply so many electrons before the chemical reaction is done. The voltage of a battery only give a basic feel of the state of the battery but has many things that influence the voltage.

So a shunt pretty much counts the number of electrons that flow through it so if you program in the battery size and the voltage that you want battery monitor hooked to the shunt to think/know when reset that the battery is fully charged.

So with a shunt and battery monitor like the Victron Smart Shunt all-in-one you know with a pretty close value of where the battery State-of-Charge is at.
 
alright after getting a shunt-type meter what next? how should I create ocv vs soc plot ? if I do based on capacity approach which is also what I am after then ocv vs soc will be meaningless right? a
better way would be to create a Capacity discharged vs SOC table?
I'm a bit confused. SOC is the opposite of capacity discharged. So 100% SOC = 0% Dischaged. 80%SOC = 20% discharged. You don't need a charge. Just read the SOC meter. Unless I am completely missing your intent?
 
I'm a bit confused. SOC is the opposite of capacity discharged. So 100% SOC = 0% Dischaged. 80%SOC = 20% discharged. You don't need a charge. Just read the SOC meter. Unless I am completely missing your intI t
I think I need to restate my point. what I mean instead of creating OCV vs SOC or DoD ( just assume soc would be dod in dchg mode) , instead of relying only on open circuit voltage vs SOC/DOD it would be more sensible to plot OCV based on Capacity charged / discharged.

usually a discharge is done from 3.65V or less as 100% SOC all the way until cell hits 2.5V as 0% SOC
but if I do discharge based on capacity then I might not be going all the way to 2.5V maybe , it could be 2.6V . do you understand what I want to do here? discharge a fixed capacity value , convert the capacity dchg throughout the test over my set capacity target so as 3500mah target cap every 1% dchg would mean 35mah and based on that capacity whatever OCV I read , I save that on to a table.
 
discharge a fixed capacity value , convert the capacity dchg throughout the test over my set capacity target so as 3500mah target cap every 1% dchg would mean 35mah and based on that capacity whatever OCV I read , I save that on to a table.
Charting that table in a graph would illustrate how flat the curve is in the middle and how steep it gets at either end. That is why voltage is not as useful as a measure of SOC. As others have said surface capacitance and voltage sag under load make it unreliable as an accurate measure of SOC for most of the flat part of the curve.. Because the curve is steep at the ends, voltage is a useful tool to use as Low Voltage Disconnect or High Voltage Disconnect. Also since there is no capacity lost as the cell settles from 3.65 to resting voltage of 3.35 the Coulomb counter takes that into account. Any voltage table should show 100% SOC from 3.65 to 3.35 volts.
 
Last edited:
I think I need to restate my point. what I mean instead of creating OCV vs SOC or DoD ( just assume soc would be dod in dchg mode) , instead of relying only on open circuit voltage vs SOC/DOD it would be more sensible to plot OCV based on Capacity charged / discharged.

usually a discharge is done from 3.65V or less as 100% SOC all the way until cell hits 2.5V as 0% SOC
but if I do discharge based on capacity then I might not be going all the way to 2.5V maybe , it could be 2.6V . do you understand what I want to do here? discharge a fixed capacity value , convert the capacity dchg throughout the test over my set capacity target so as 3500mah target cap every 1% dchg would mean 35mah and based on that capacity whatever OCV I read , I save that on to a table.
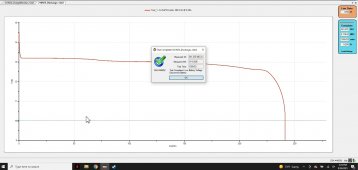
To clarify for myself, is this the chart you want to create?

The thing you're talking about where the cell rebounds a bit after discharging can be alleviated by using a very low discharge current. The rebound will likely be a couple mV.

Is it that important?

Screenshot_20210926-142517.jpg
 
Charting that table in a graph would illustrate how flat the curve is in the middle and how steep it gets at either end. That is why voltage is not as useful as a measure of SOC. As others have said surface capacitance and voltage sag under load make it unreliable as an accurate measure of SOC for most of the flat part of the curve.. Because the curve is steep at the ends, voltage is a useful tool to use as Low Voltage Disconnect or High Voltage Disconnect. Also since there is no capacity lost as the cell settles from 3.65 to resting voltage of 3.35 the Coulomb counter takes that into account. Any voltage table should show 100% SOC from 3.65 to 3.35 volts.
yes completely agree with your point , Can you please suggest me how should I plot my table for SOC vs OCV using the shunt .... I can then follow that , also I went with 0.2C so Vter = Vocv+IR so at 0.2C the current is fairly less and then after giving hours of rest and measuring OCV I can then sort of eliminating the IR loss ( I am working with new cells so the internal resistance is very small).

I have done capacity tests on multiple cells and then came with avg capacity that I should set as my set point and based on that I charge or discharge from 1% to 100%

what would be really nice is if you can suggest me the right procedure in steps so I can then create a sensible table out of it ?
 
To clarify for myself, is this the chart you want to create?

The thing you're talking about where the cell rebounds a bit after discharging can be alleviated by using a very low discharge current. The rebound will likely be a couple mV.

Is it that important?

View attachment 68536
yes exactly this chart and I dcg and chg at 0.2C (0.68A) compared to rated 3.4A(1C) , I want to create this chart and record this OCV vs SOC and also respective capacity in a table
 
Last edited:
The thing you're talking about where the cell rebounds a bit after discharging can be alleviated by using a very low discharge current.
Yes you can create a table that has very little voltage sag by using a very low discharge current. However in real life that table will not be accurate for other higher discharge rates. You would need a separate table or more columns for various discharge currents.
 
What myself and others are saying is why bother with all those tables for various discharge rates. Just use a shunt that tracks SOC.
this is part of my degree project, I am a student :). if I could have bought (afford) the Victron shunt then I shouldn't make this thread haha but here as I am studying batteries and want to understand the LFP chem in-depth as later I will jump to bigger cells and so on ?.
 
The most important thing to understand about Lithium batteries is that voltage is not a good measure of SOC. If you frame that statement as a hypothesis then your data points at various currents most likely will prove that hypothesis.
 
The most important thing to understand about Lithium batteries is that voltage is not a good measure of SOC. If you frame that statement as a hypothesis then your data points at various currents most likely will prove that hypothesis.
yes sure , thats why I have stated above that I am doing it based on a shunt , I am discharging based on capacity and whatever OCV I get I save that on the table. I just want to know whether I should I charge my cell to 3.65V and then start test or give it rest for 24hours or several hours before starting it . also When I dishcharged the cell as it reaches 2.5V , the test is stopped but then after some restingtime ( 3-4hours) I see voltage jumps up to 2.9-3V and yes here I did make sure I have discharged enough as I am using a shunt.
just confused why the OCV goes to 3V and not like 2.5or 2.6V
 
Back
Top