diy solar

diy solar

How to create SOC vs OCV chart for LFP cell ?

Yes you can create a table that has very little voltage sag by using a very low discharge current. However in real life that table will not be accurate for other higher discharge rates. You would need a separate table or more columns for various discharge currents.
If you're using it to track state of charge you're nuts lol
 
your proposal sir ? ;)
Ignore the whole thing and use a shunt.

Regarding resting, charge to 3.65v until the current drops to some fraction of a percent or if you're really brave, zero.

Then test with a very low discharge. Very very low.

If you have small cells you'll probably see a lot more rebound. The voltage I saw after testing my 280s was a maybe 0.05v or so, but that was at a 0.036C rate.
 
I just want to know whether I should I charge my cell to 3.65V and then start test or give it rest for 24hours or several hours before starting it . also When I dishcharged the cell as it reaches 2.5V , the test is stopped but then after some restingtime ( 3-4hours) I see voltage jumps up to 2.9-3V and yes here I did make sure I have discharged enough as I am using a shunt.
Try it both ways and collect the data. Those two data points alone prove the hypothesis that voltage is not a good measure of SOC. To be more scientific you should have more data points and you should discharge at different currents for each set of data to see if there is a difference. If your shunt is a simple one that does not have a Coulomb counter then you should record voltage and current at regular intervals during that process. You can then calculate Amphours or preferably Watthours. Most people would agree that Watthours is the more accurate method of measuring capacity of batteries because it integrates the change in voltage during discharge.
 
Last edited:
this is part of my degree project, I am a student :). if I could have bought (afford) the Victron shunt then I shouldn't make this thread haha but here as I am studying batteries and want to understand the LFP chem in-depth as later I will jump to bigger cells and so on ?.

This explains the goal. As long as you understand that you can not use OCV for pretty much anything other than making a nice graph on a computer or piece of paper. It can not be used for tracking SOC. A rebound of a few mV could be a huge error in estimated SOC. But for making a nice graph for school, and perhaps for locating where the knees are, making the table is fine.

For purposes of the school project, I propose this, to create 4 graphs.
1. Start with the battery at 100% SOC, and with a quality shunt SOC meter like the Victron. They should be properly set up and calibrated.
2. Apply a charge voltage and top off to 3.65V per cell. Record data.
3. Wait 24 Hours.
4. Record data. This shows the difference between "fully charged" and "fully charged resting" voltages.
5. Apply 0.5C load. Watch the Meter until it goes down by 2% Record voltage. This will be for graph one, a discharge graph.
6. Wait 24 hours and record voltage. This will be for graph two, a resting after discharge graph.
7 Repeat 5 & 6 until you get to 90%. Then you can repeat at 10% intervals until you get to 10% and go back to 2%.
8. After you get to 0%. Repeat the process by charging at 0.5C until you get to 100% This will be the charging graph and resting after charging graph.

After you are done a few weeks later, the 4 graphs should show the very flat curve through most of the range. They should also show that because there is difference between charging, resting, and discharging graphs, that using ocv could result in as much as an 80% error in your guess at SOC.
 
yes sure , thats why I have stated above that I am doing it based on a shunt , I am discharging based on capacity and whatever OCV I get I save that on the table. I just want to know whether I should I charge my cell to 3.65V and then start test or give it rest for 24hours or several hours before starting it . also When I dishcharged the cell as it reaches 2.5V , the test is stopped but then after some restingtime ( 3-4hours) I see voltage jumps up to 2.9-3V and yes here I did make sure I have discharged enough as I am using a shunt.
just confused why the OCV goes to 3V and not like 2.5or 2.6V
I don't understand the chemistry of the process to know "why" but the rebound you see is exactly what is expected. The amount of rebound will vary depending on the discharge rate, and where in the battery curve you are. It is also why other than to make a pretty graph, the data is meaningless.
 
I don't understand the chemistry of the process to know "why" but the rebound you see is exactly what is expected. The amount of rebound will vary depending on the discharge rate, and where in the battery curve you are. It is also why other than to make a pretty graph, the data is meaningless.
hmm so If I talk about data here which is my most interesting point of interest, what If I log the capacity values as well for these voltage points so when I do the estimation using CC. I will go to my lookup table and based on what my current battery cell voltage is I will use that Cap(SOC) value as my starting point in the formula.
 

Attachments

  • EQ_1602481430.jpg
    EQ_1602481430.jpg
    50.4 KB · Views: 11
hmm so If I talk about data here which is my most interesting point of interest, what If I log the capacity values as well for these voltage points so when I do the estimation using CC. I will go to my lookup table and based on what my current battery cell voltage is I will use that Cap(SOC) value as my starting point in the formula.
I don't understand what you are attempting to do. But if you are looking up voltages in a table as part of the formula, the results will be wrong. Make the 4 graphs I proposed earlier, and decide what else you want to try after you have those charts in hand.
 
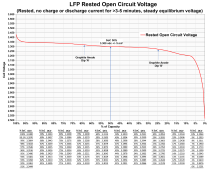
When a LFP cell is fully charged up to 3.65v with charge current tapering off to low levels, overpotential charge voltage is traded for surface capacitance charge. For LFP cell, the capacity stored in this surface charge capacitance is small, only amounting to about 0.01% of cell's AH rating. Most of this surface charge happens in the anode graphite layer. It is similar to a supercap.

Left in unloaded open circuit state this surface capacitance charge can take a few days to bleed off on its own. You can bleed most of it off with an external load resistor in about a minute.

Once this surface charge is discharged the open circuit terminal voltage will be about 3.45v for a fully charged LFP cell.

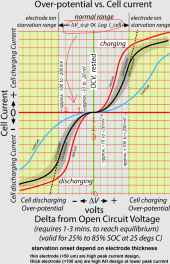
To do a graph of open circuit voltage vs state of charge you need to understand overpotential. For an LFP cell it takes a minute or two after a cell current demand change for terminal voltage to reach equilibrium. It has an exponential time decay to the new equilibrium before it approaches steady terminal voltage for given cell current (discharge current has slump in open circuit terminal voltage, charge current rises terminal voltage). The time decay and amount of overpotential voltage is greater near full state of charge and at the bottom 15% state of charge.

You also need a fairly accurate voltmeter. Better than a few mV of accuracy.

At a given state of charge you have to be sure you wait enough time, at zero cell current, for the open circuit equilibrium terminal voltage to be reached. Overpotential voltage versus cell current is temperature dependent. Rested OCV LFP terminal voltage is not very temperature dependant.

View attachment 67876

View attachment 67877
Can I know how did you achieve this graph of Rested OCV vs SOC . thanks
 
victron shunt is expensive and quite accurate. so i tried a hack to do it cheaper and it’s performance has been decently usable.

ingredients:
AiLi 350A shunt 45usd currently
1634505910798.jpeg
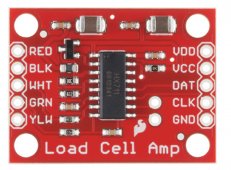
HX711 load cell amplifier 10usd currently
1634505924947.jpeg

the HX711 as you will find on the data sheet is a 24-bit ADC which means it’s very inexpensive and high performance. it has two inputs and is a differential ADC which is perfect for low side shunt configuration. i removed the factory electronics and simply attached one pin to one side of shunt to sample voltage there and other pin to other side of shunt to sample voltage drop across shunt resistor. it allows very fine grained monitoring of current and thus SOC calculation with top voltage synchronization algorithm.

to do zero current calibration simply unplug everything and record a minute or two of data, average it, and enter that into the arduino program. getting absolute scale can be done by a number of ways, clamp amp meter, etc

i want to have many packs all cooperating and each with an individual shunt coulomb meter so that is the motivation of this cost saving hack. too expensive to get a bunch of victron shunts.

wishing you good luck in your studies!
 
Can I know how did you achieve this graph of Rested OCV vs SOC . thanks
My apologies is this is too basic but you have repeatedly asked it so here it is. I assume your data collection process is tabulated into two columns. One column is voltage and the other is SOC. Then grab a piece of graph paper and label one axis voltage and the other axis SOC. Then put a dot for the spot on your graph paper where voltage and SOC intersect. Continue to do that for each set of values. Finally connect the dots. That is how you "achieve" or plot a graph from data in a table. Hopefully that answers your question.;)
 
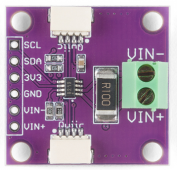
by the way if you need something to measure voltage, the INA219 8usd is a very good chip for that in my experience
1634506184630.png

This is the chip I'm using for my DIY LiFePO4 learning adventures. Keep in mind this chip can only really work with 12V LiFePO4 systems due to its 26V max rating. It allows me to use a cheap $5 arduino to read voltage to within 4mV DC Accuracy on Datasheet. 1mV is my desired tolerance due to LFP Middle Flatness Factor, but it's only $8 chip so i mean it's pretty fantastic. However it will add up in cost i guess if you use one for each cell in a 12V build.

Good luck in your studies and experiments!
 
Can I know how did you achieve this graph of Rested OCV vs SOC . thanks
i would use an arduino and a relay and an INA219 chip. can link you all the parts and provide a general overview of how to make it, just ask. basically the arduino will measure the voltage of the battery and then execute a program of turning a relay on by turning an arduino pin HIGH or LOW (arduino terms).

the program would look something like this:
#include Arduino.h float AmpSecondsTotal = 0; float VoltageRest = 0; float VoltageActive = 0; float Current = 0; while(true) { VoltageRest = measureVoltageINA219(); enableDischargeRelay(); delay(1000); disableDischargeRelay(); delay(1000); VoltageActive = measureVoltageINA219(); Serial.print(millis()*1e-3); Serial.print(", "); Serial.print(VoltageRest); Serial.print(", "); Serial.print(VoltageActive); }

please ask as many questions as you like

arduino has helped me with many experiments :)
 
When a LFP cell is fully charged up to 3.65v with charge current tapering off to low levels, overpotential charge voltage is traded for surface capacitance charge. For LFP cell, the capacity stored in this surface charge capacitance is small, only amounting to about 0.01% of cell's AH rating. Most of this surface charge happens in the anode graphite layer. It is similar to a supercap.

Left in unloaded open circuit state this surface capacitance charge can take a few days to bleed off on its own. You can bleed most of it off with an external load resistor in about a minute.

Once this surface charge is discharged the open circuit terminal voltage will be about 3.45v for a fully charged LFP cell.

To do a graph of open circuit voltage vs state of charge you need to understand overpotential. For an LFP cell it takes a minute or two after a cell current demand change for terminal voltage to reach equilibrium. It has an exponential time decay to the new equilibrium before it approaches steady terminal voltage for given cell current (discharge current has slump in open circuit terminal voltage, charge current rises terminal voltage). The time decay and amount of overpotential voltage is greater near full state of charge and at the bottom 15% state of charge.

You also need a fairly accurate voltmeter. Better than a few mV of accuracy.

At a given state of charge you have to be sure you wait enough time, at zero cell current, for the open circuit equilibrium terminal voltage to be reached. Overpotential voltage versus cell current is temperature dependent. Rested OCV LFP terminal voltage is not very temperature dependant.

View attachment 67876

View attachment 67877
Dear RCinFLA, where did you come up with this over-potential chart/graphic above? It's quite interesting. Did you build it yourself from empirical data? Cheers,
 
Dear RCinFLA, where did you come up with this over-potential chart/graphic above? It's quite interesting. Did you build it yourself from empirical data? Cheers,
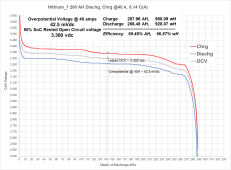
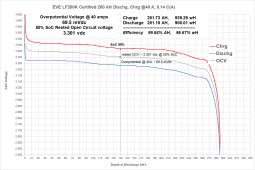
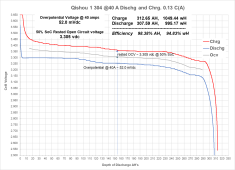
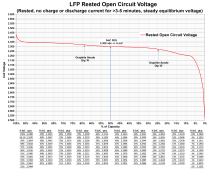
It is built from raw .csv data from several manufacturers of 280 AH and 304 AH cells. It is average of about 8 cells from several manufacturers with 3 sigma spread less than 3 millivolts at 50% SoC.

It was derived starting with full charge with 40 amp full discharge followed by full 40 amp recharge. LFP overpotential for discharge and charge is very similar so voltage slump for 40 amp discharge is fairly close to voltage bump during 40 amp charge.

The incremental AH's and wH summation is calculated through the SoC. Since charging is slightly less efficient (a very small amount) than discharging the discharge and charge data is normalized.

After normalized, it is just split the difference between charge bump and discharge slump to get no-load rested open circuit voltage.

A slightly better way to get no-load state of charge would be to allow a rest period during charge and discharge for about 5 minutes to allow cell to return to OCV value. This doesn't take much more time during discharge or charge test and should be installed at approximately 75% SoC, 50% SoC and 25% SoC. The 5 minute rest periods of zero cell current will not impact the AH or wH summation total.

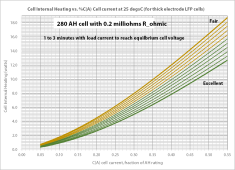
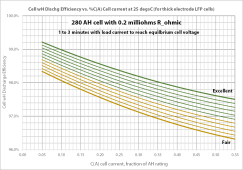
Another important piece of info is the overpotential voltage for given cell current. Less is better. As cells age the overpotential voltage discharge slump or charging bump increases.

Temperature of testing is important as overpotential due to cell current is dependent on temperature. Testing should be done is 20-30 degrees C temp range. Colder temps, below +15 degs C have increased overpotential voltage.

Here are a couple of examples:
1688166206945.png
1688166256621.png
1688166458783.png

Average of tested cells, with tabular data below graph.
LFP Open Circuit Voltage vs SoC.png

Overpotential charts:
1688169096726.png

1688169138291.png

1688169262381.png
 
Last edited:
It is built from raw .csv data from several manufacturers of 280 AH and 304 AH cells. It is average of about 8 cells from several manufacturers with 3 sigma spread less than 3 millivolts at 50% SoC.

It was derived starting with full charge with 40 amp full discharge followed by full 40 amp recharge. LFP overpotential for discharge and charge is very similar so voltage slump for 40 amp discharge is fairly close to voltage bump during 40 amp charge.

The incremental AH's and wH summation is calculated through the SoC. Since charging is slightly less efficient (a very small amount) than discharging the discharge and charge data is normalized.

After normalized, it is just split the difference between charge bump and discharge slump to get no-load rested open circuit voltage.

A slightly better way to get no-load state of charge would be to allow a rest period during charge and discharge for about 5 minutes to allow cell to return to OCV value. This doesn't take much more time during discharge or charge test and should be installed at approximately 75% SoC, 50% SoC and 25% SoC. The 5 minute rest periods of zero cell current will not impact the AH or wH summation total.

Another important piece of info is the overpotential voltage for given cell current. Less is better. As cells age the overpotential voltage discharge slump or charging bump increases.

Temperature of testing is important as overpotential due to cell current is dependent on temperature. Testing should be done is 20-30 degrees C temp range. Colder temps, below +15 degs C have increased overpotential voltage.

Here are a couple of examples:
View attachment 155192
View attachment 155193
View attachment 155195

Average of tested cells, with tabular data below graph.
View attachment 155197

Overpotential charts:
View attachment 155206

View attachment 155207

View attachment 155209
Dear RCinFLA,

This is really great work! Nicely done!

I'm trying to understand your generalized formula of "Delta o-p being proportional to Log-of-current". I've pasted the chart below with some red highlights. I can't make the square grid fit to a plot of "...proportion of log of current", no matter what units I try to imagine on the grid. Can you give a few example data points of, say, three different o-p values, and three different current (I) values, and the three different corresponding Log-of-current values, so I can understand how to interpret your stated proportional log formula?

Cheers,

1688513321428.png
 
Dear RCinFLA,

This is really great work! Nicely done!

I'm trying to understand your generalized formula of "Delta o-p being proportional to Log-of-current". I've pasted the chart below with some red highlights. I can't make the square grid fit to a plot of "...proportion of log of current", no matter what units I try to imagine on the grid. Can you give a few example data points of, say, three different o-p values, and three different current (I) values, and the three different corresponding Log-of-current values, so I can understand how to interpret your stated proportional log formula?

Cheers,

View attachment 155812

This drawing is made to show the generic shape which is proportional to log of current. Different electrode thicknesses have different absolute values but shape is same.

The curves in above prior post show actual numbers for thick electrode LFP cell, typical the DIY 'blue' cells, specifically for EVE 280 AH at 25 degs C. Thick electrode cell gives greatest AH for size and weight but poorer maximum cell current capability.

The electrode thickness is an obsticle to lithium-ion migration through the thicker electrode. There is also a layer ion stavation effect that starts around 0.5 CA for thick electrode cells. This starvation requires more overpotential above the normal log relationship to force the lithium-ion migration rate to support the externally demanded cell current. I stopped the curve at 0.55 C(A) because the best fit equations start to deviate too much above onset of electrode starvation.

The cell net overpotential is a combination of separate overpotentials for the graphite negative electrode and LPF positive electrode.
 
If you have a DVM with better than 0.05% accuracy (about +/- 2 mV at 3.4vdc) and you allow cells to rest long enough at zero cell current (no charging or discharging current) until cell reaches steady equilibrium rested voltage (about 3-5 minutes), cell voltage is a good indicator of state of charge.

Most folks don't have the DVM accuracy. Two cheaper DVM that do pretty good is Uni-T UT61E and ANENG AN870. They are 22,000 count and 20,000 count meters, respectively with 0.05% accuracy. They don't hold their accuracy over temperature so try to stay in the 20-30 degree C range with these DVM's.
LFP Open Circuit Voltage vs SoC.png
 
This drawing is made to show the generic shape which is proportional to log of current. Different electrode thicknesses have different absolute values but shape is same.

The curves in above prior post show actual numbers for thick electrode LFP cell, typical the DIY 'blue' cells, specifically for EVE 280 AH at 25 degs C. Thick electrode cell gives greatest AH for size and weight but poorer maximum cell current capability.

The electrode thickness is an obsticle to lithium-ion migration through the thicker electrode. There is also a layer ion stavation effect that starts around 0.5 CA for thick electrode cells. This starvation requires more overpotential above the normal log relationship to force the lithium-ion migration rate to support the externally demanded cell current. I stopped the curve at 0.55 C(A) because the best fit equations start to deviate too much above onset of electrode starvation.

The cell net overpotential is a combination of separate overpotentials for the graphite negative electrode and LPF positive electrode.
Hi RCinFLA,

Ok, so just in terms of the generic shape (not a specific electrode thickness) could I say, so that I understand more clearly, the proportional log relationship you're talking about:

"ΔV_o-p ∝ log-base-10 (I_cell)"?

or in other words, for discharge, in a longform plain English wording example:

"The voltage sag in millivolts during discharge is proportional to the log-base-ten of the discharge current of the cell in amps"?

Am I saying that accurately/correctly?
 
Back
Top