


Hi I have a system off 22 panels each 395W and it was designed to produce 8.75KW .
Picture attached ( original Plan Design)
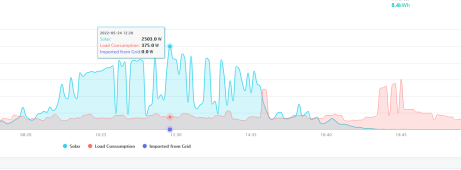
and the peak I get from Enphase controller is about 6-6.2KW in perfect conditions all panels exposed to sun. (Picture attached- production)
I am not sure if I understand correctly but should my system be close (Peek Power) around 7.5-8.7KW ?
6.2KW seems low like 30% production loss in its original design...
Am I right or wrong.. please help me to understand real time production performance.
Controller updates every 15Min but I get about 60% of a day of full roof exposure and peek number seems low...
I tried to check with the installer but he beats me around the bushes about monthly production that I suppose oxide what they estimated.
But I get the feeling I should be getting more if Peek performance was close to original design.
Please advise.
thanks
Peter.


Picture attached ( original Plan Design)
and the peak I get from Enphase controller is about 6-6.2KW in perfect conditions all panels exposed to sun. (Picture attached- production)
I am not sure if I understand correctly but should my system be close (Peek Power) around 7.5-8.7KW ?
6.2KW seems low like 30% production loss in its original design...
Am I right or wrong.. please help me to understand real time production performance.
Controller updates every 15Min but I get about 60% of a day of full roof exposure and peek number seems low...
I tried to check with the installer but he beats me around the bushes about monthly production that I suppose oxide what they estimated.
But I get the feeling I should be getting more if Peek performance was close to original design.
Please advise.
thanks
Peter.


") I know Plan shows old style which was not compatible with new backup systems.
I know Plan shows old style which was not compatible with new backup systems.