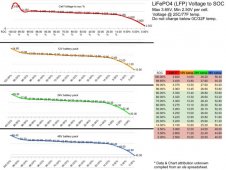
Would a voltage chart showing what percentage of charge for a 24v battery be double the voltage of a 12v battery? My LIFePo4 24v battery without a load shows 26.77v which is twice the voltage in the12v chart showing it is close to 99% of capacity.


You are using an out of date browser. It may not display this or other websites correctly.
You should upgrade or use an alternative browser.
You should upgrade or use an alternative browser.
LiFEPo4 24v voltage chart
- Thread starter BJohnson
- Start date
MrNatural22
?SW sunshine =⚡️⚡️lit up thru the darkness✌️
? Yes pretty much just double what your 12v Chart says. The chart is based on resting voltage after the battery sits a while.
26.77v resting on your 24v battery is 13.385v resting for 12v which is basically <99%>
26.77v resting on your 24v battery is 13.385v resting for 12v which is basically <99%>
curiouscarbon
Science Penguin
- Joined
- Jun 29, 2020
- Messages
- 3,022

RickP
Solar Power Padawan
That is a very good chart! Not only does it show the volt/SOC relationship, but also graphically shows how little difference in voltage there is before the very rapid decline near discharge. Many people, especially those new the LiFeP04 batteries, don’t realize that a one volt drop... say, from 27 to 26 volts, can represent half of your battery bank’s power supply. It’s an eye opener coming from other battery types, for sure.This is a good chart IMO.
rykelo
New Member
- Joined
- Sep 3, 2021
- Messages
- 38
Do the red zones represent anything in particular? For example, my understanding is that with lead acids it shortens the battery's life to discharge them completely... so staying within the 50% - 100% charge range is better for longevity. Does this chart show a similar "ideal charge range" for LiFePo4s (roughly 20%-99%)?
Ampster
Renewable Energy Hobbyist
I would call the red zones, danger zones. Those are where in a few minutes something bad can happen. The charge and discharge curves become steep and that is where a cell can easily become a runner.Do the red zones represent anything in particular?
In addition to what Ampster said, a BMS will keep the cells from running on ether end of the scale. In ideal temps one can expect at least a 2000 cycle life if charging to 3.65 volts and discharging to 2.50 volts and keeping float voltages reasonable. The majority of us keep the cells between the knees of the curve which will help extend cycle life. That's what the chart represents more than anything IMO.Do the red zones represent anything in particular? For example, my understanding is that with lead acids it shortens the battery's life to discharge them completely... so staying within the 50% - 100% charge range is better for longevity. Does this chart show a similar "ideal charge range" for LiFePo4s (roughly 20%-99%)?
Keep in mind most don't put the cells through a full cycle every day, but if one did one should expect around 5.5 years of service and then the cells should have 80% capacity left.
MisterSandals
Participation Medalist
How are you using your batteries? Do you need to squeeze every watt hour out each day?should I modify these settings to keep things more in the green?
Do you have continual loads like a fridge?
Do the batteries sit unused for days or weeks?
rykelo
New Member
- Joined
- Sep 3, 2021
- Messages
- 38
At the moment they're being stored in my basement (currently sitting at 26.8V) but during the spring/summer/fall they help run a refrigerator (along with PV direct from the panels) as well as LED lights, occasional tools, charge laptops and phones etc from the trailer. So yes, continual loads, I don't know if I need to squeeze every watt hour.. probably not. And yes the batteries sit unused for days and weeks because it's essentially a cottage property situation where I'm only there weekends.
MisterSandals
Participation Medalist
Those settings look good for when you will be there with fridge running. A smidge higher than I would but still very good. When in storage, I would float around 26.4V.
Enjoy your setup.
Enjoy your setup.
rykelo
New Member
- Joined
- Sep 3, 2021
- Messages
- 38
Thanks! Much appreciated.Those settings look good for when you will be there with fridge running. A smidge higher than I would but still very good. When in storage, I would float around 26.4V.
Enjoy your setup.
Similar threads
- Replies
- 254
- Views
- 3K
- Replies
- 1
- Views
- 237