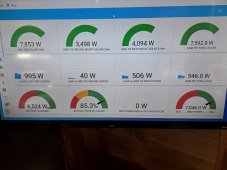
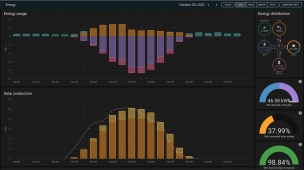
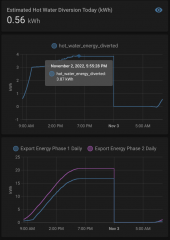
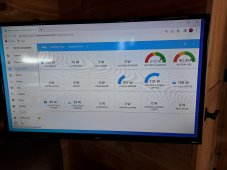
I am a complete noobie with home assistant, but here is my first attempt at creating a dashboard to monitor my system.
this was needed because all 3 systems have different types of data sources, web sites, etc
OFF GRID system is 12kw with 2 LV6548 inverters and 6 eg4 batteries. It uses Solar Assistant for data.
GRID TIE - ground mount system is 4.9kw using a new SMA6000us-41 inverter with internal wifi/sunny portal.
GRID TIE - roof mount system is 6.4kw using a 10 year old SMA6000 inverter, with an antique datalogger with no accessable data. I get its production and load data from the emporia vue
All circuits in the off grid house, and also on 2 grid only outbuildings are using the emporia vue 2 systems for monitoring.
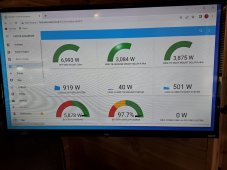
I wish I could use some of the other info from Solar Assistant like % of battery charging, and average battery state of charge ( I have a display of batt SOC, but it is actually the data from batt #2 which I selected as it seemed about average among the 6 batteries) These 2 items seem to be calculations not data so are not avbl from the inverters
I also wish I could add and subtract the info from 2 different sensors, to display the total PV of the 2 grid tied systems and also the power returned to the grid after the loads
another minor issue is that all the circuit use data from emporia view is based on the 1 minute data they supply to home assistant, if you use the emporia app itself they have 1 second/instant data avbl
I have a 32 inch TV setup at a full time monitor. I usually display the first dashboard which shows the solar power etc during the day, and then switch to the circuit usage dashboard after dark, so I can see all loads and also batt charge rate and SOC
suggestions/comments appreciated


Last edited:


