You are using an out of date browser. It may not display this or other websites correctly.
You should upgrade or use an alternative browser.
You should upgrade or use an alternative browser.
Off-grid Solar / Battery monitoring and control freeware
- Thread starter BarkingSpider
- Start date
Thank you for this, I will look into updating my setup with this.Well I did some rewirte of the code, you can select different Protocol version
I tried experimenting with this too. I couldn't figure out how to change the colour.Can anyboy give me a advice for Grafana:
I use the panel from joe. So it should show the status. It's configured to show the last "myStr" but it didn't worked yesterday.
Is it possible to change color too? Also if it goes from "Release" to "Protection" or int value from "0" to "1" change color / bgcolor? HOW is this done?
Currently trying to figure out how to get Grafana to calculate KWh totals for the day. Can't seem to get the code right though.
Basically summing up aggvolts*current for every time reading and putting that figure up.
TheSmartGerman
New Member
- Joined
- Feb 10, 2021
- Messages
- 45
For my output, node exporter reads this for the charge/discharge metric:
BMS_A{mode="modeInt",myStr="Discharge"} 0
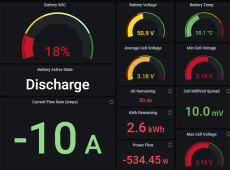
For my dashboard, which I've adapted from Joe, this shows as either Charge or Discharge. It appears you already have this in your picture above. Were you after something different?
View attachment 90625
Well, I also adopted the Dashboard from Joe.
My "problem" is, the numerical numbers are updated fine. But the txt from "myStr" is not shown immediatly. Eg. Currentflow is -10A, but the working mode still shows "Storage". If I check the data "Inspect" -> "Data" the myStr is "Discharge".
Oh that's easy to fix. When you edit the display for that metric, tick the instant box. Then it updates instantly and does no history calculations.Well, I also adopted the Dashboard from Joe.
My "problem" is, the numerical numbers are updated fine. But the txt from "myStr" is not shown immediatly. Eg. Currentflow is -10A, but the working mode still shows "Storage". If I check the data "Inspect" -> "Data" the myStr is "Discharge".
TheSmartGerman
New Member
- Joined
- Feb 10, 2021
- Messages
- 45
Perfect! This did the trick! ThxOh that's easy to fix. When you edit the display for that metric, tick the instant box. Then it updates instantly and does no history calculations.
Is someone able to make an extended cheat sheet for those that aren't familiar with Unix commands? Ideally one that you follow line by line and leaves no guessing or googling commands
I've started from the beginning here:

Data Communication
This section deals with data communication protocols and visualization tools for charge controllers, battery management systems, inverters and others. It includes set-up guides for tools such as Grafana, on R-Pi and other platforms.
I will add entries specifically for Raspberry Pi, and then expand on communication with devices etc. Keep in mind I don't have a lot of spare time, but I will work on this as and when I can...
Update: also added the RPi section and the Grafana/Prometheus configuration part:

 diysolarforum.com

Data Communication
This section deals with data communication protocols and visualization tools for charge controllers, battery management systems, inverters and others. It includes set-up guides for tools such as Grafana, on R-Pi and other platforms.
memilanuk
New Member
- Joined
- Apr 21, 2021
- Messages
- 125
Update: also added the RPi section and the Grafana/Prometheus configuration part:

Data Communication
This section deals with data communication protocols and visualization tools for charge controllers, battery management systems, inverters and others. It includes set-up guides for tools such as Grafana, on R-Pi and other platforms.diysolarforum.com
Good stuff!!! Looking forward to the next installment(s)!
Has anyone on here tried using this project but instead of using a serial to USB cable, wiring the RJ12 cable to the RPI GPIO port with a voltage level shifter in the middle to handle the 3.3v to 5v conversion? I'm trying to as my project has a power intensive USB LTE dongle attached which stops working when any other usb device is connected. I'm trying to go directly to the RPI GPIO ports and have confirmed that the RPI TX > to Rover RX and vice versus for the RX < TX pins are mapped properly. The RPI serial port is working as well as the shifter and I confirmed this by creating a loopback on the 5v side of the shifter and am able to successfully send and receive loopback data on the RPI but when I connect it to the Rover all I get is "no communication from the instrument". I have used a multimeter and also confirmed the TX (5.6v) and RX (0.7v) on the serial cable so I know its working as well. Below is what I get when trying to run the renogy_rover.py file. Any assistance would be greatly appreciated!
Traceback (most recent call last):
File "renogy_rover.py", line 186, in <module>
print('Model: ', rover.model())
File "renogy_rover.py", line 41, in model
return self.read_string(12, numberOfRegisters=8)
File "/home/pi/.local/lib/python2.7/site-packages/minimalmodbus.py", line 443, in read_string
numberOfRegisters=numberOfRegisters, payloadformat='string')
File "/home/pi/.local/lib/python2.7/site-packages/minimalmodbus.py", line 697, in _genericCommand
payloadFromSlave = self._performCommand(functioncode, payloadToSlave)
File "/home/pi/.local/lib/python2.7/site-packages/minimalmodbus.py", line 795, in _performCommand
response = self._communicate(request, number_of_bytes_to_read)
File "/home/pi/.local/lib/python2.7/site-packages/minimalmodbus.py", line 930, in _communicate
raise IOError('No communication with the instrument (no answer)')
IOError: No communication with the instrument (no answer)
Ahh I wish I knew the default data retention time is only 15 days for prometheus! Have had my pi recording for the past 2 months and I've just realised it only stored 15 days worth 
Good thing to add to everyone's cheat sheets, is to modify the prometheus.service file for longer data retention;
add
below the last line of the heading
line.
Your file prometheus.service file should look something like this:
Or whatever timeframe you want. Before that data is lost...
Then
systemctl daemon-reload
systemctl restart prometheus
systemctl status prometheus
Good thing to add to everyone's cheat sheets, is to modify the prometheus.service file for longer data retention;
Code:
nano /etc/systemd/system/prometheus.serviceadd
Code:
--storage.tsdb.retention.time=1y
Code:
ExecStart=/usr/local/bin/prometheus \Your file prometheus.service file should look something like this:
Code:
[Unit]
Description=Prometheus Server
Documentation=https://prometheus.io/docs/introduction/overview/
After=network-online.target

[Service]
User=pi
Restart=on-failure

ExecStart=/home/solar/Dev/prometheus/prometheus \
  --config.file=/home/solar/Dev/prometheus/prometheus.yml \
  --storage.tsdb.path=/home/solar/Dev/prometheus/data \
  --storage.tsdb.retention.time=3y \
  --storage.tsdb.retention.size=20GiB

[Install]
WantedBy=multi-user.target
Or whatever timeframe you want. Before that data is lost...
Then
systemctl daemon-reload
systemctl restart prometheus
systemctl status prometheus
Last edited:
Ahh I wish I knew the default data retention time is only 15 days for prometheus!
Thanks for the reminder. I've updated the Wiki on this.
cosmam2001
New Member
- Joined
- Jun 2, 2022
- Messages
- 1
I'd be willing to create a docker image / docker-compose file out of all this for easy deploy on raspberry pi. Balena OS uses containers by default as do a few others. Otherwise a standard ubuntu image with docker would do the trick.
I have a samlex 4024 myself and want to grab the data from it and join it with the my other victron devices using venus OS. Where was the source for this?
I have a samlex 4024 myself and want to grab the data from it and join it with the my other victron devices using venus OS. Where was the source for this?
Hey all, long time lurker, first time poster...
Firstly, I would like to commend all of the efforts, this looks great, I just wish I could get more than the basic Pi metrics in to Grafana...
I am stuck getting data from my Renogy Elite 40a, I have the RJ45 to RS485/USB cable made by Renogy, I have Prometheus and Grafana up and running, but I can't verify that I am getting any data from the controller.
That or I just don't understand how to get data in to Grafana.
I have run through the cheat sheet several times, unfortunately I don't want to use the Pi solely for monitoring the solar stuff, I also am going to be using it for OpenPlotter, someone earlier mentioned Node-Red & OpenPlotter.
Which means I can't follow the script exactly, which then means, I don't know which part is wrong...
Hey all, long time lurker, first time poster...
Firstly, I would like to commend all of the efforts, this looks great, I just wish I could get more than the basic Pi metrics in to Grafana...
I am stuck getting data from my Renogy Elite 40a, I have the RJ45 to RS485/USB cable made by Renogy, I have Prometheus and Grafana up and running, but I can't verify that I am getting any data from the controller.
That or I just don't understand how to get data in to Grafana.
I have run through the cheat sheet several times, unfortunately I don't want to use the Pi solely for monitoring the solar stuff, I also am going to be using it for OpenPlotter, someone earlier mentioned Node-Red & OpenPlotter.
Which means I can't follow the script exactly, which then means, I don't know which part is wrong...
Try running the renogy_rover.py script directly from the command prompt. That will show you if you are getting the data from the controller or not.
Call me crazy, but I don't see a renogy_rover.py script anywhere, I do see RenogyWanderer.pyTry running the renogy_rover.py script directly from the command prompt. That will show you if you are getting the data from the controller or not.
Steve_S
Offgrid Cabineer, N.E. Ontario, Canada
Samlex has ModBus via RS485 but it is NOT Public and never will be.I have a samlex 4024 myself and want to grab the data from it
To get it, requires a LOT of effort & NDA's must be signed off. I did so and have the information BUT due to NDA cannot & will not share it.
Sorry but it is what it is and sadly many people are left in a Lurch because of it.
spurgelaurels
New Member
- Joined
- Jul 9, 2022
- Messages
- 13
I spent a LONG time hacking at this on the hardware and software level, only to realize that my particular version of Renogy Wanderer required modbus channel 0xFF. If you're using SolarThing's modbus scanning function, be aware that it doesn't scan modbus above 240, so you won't catch this.
In BarkingSpider's code, this line needs to be adjusted to 255.
In BarkingSpider's code, this line needs to be adjusted to 255.
Code:
27 renogy = minimalmodbus.Instrument(devName, 255)shadowsteve
Solar Enthusiast
- Joined
- Feb 11, 2021
- Messages
- 265
Wanderer and Rover have the same register format as I recall. I'm running a Py script against a Rover in my systemCall me crazy, but I don't see a renogy_rover.py script anywhere, I do see RenogyWanderer.py
spurgelaurels
New Member
- Joined
- Jul 9, 2022
- Messages
- 13
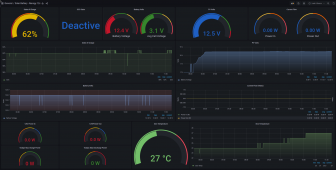
I've adapted the Grafana dashboard to suit my purposes by removing a few items that I didn't need and placing the items I need to see next to each other in a way that fits on a single screen. I've attached the JSON to this post for anyone who wants a starting point like this.
Thanks to everyone who contributed to this mega-thread. It has been the most helpful resource for this project. Cheers!
[edit: json attachments weren't allowed.... renamed to .txt]

Thanks to everyone who contributed to this mega-thread. It has been the most helpful resource for this project. Cheers!
[edit: json attachments weren't allowed.... renamed to .txt]

Attachments
shadowsteve
Solar Enthusiast
- Joined
- Feb 11, 2021
- Messages
- 265
I've adapted the Grafana dashboard to suit my purposes by removing a few items that I didn't need and placing the items I need to see next to each other in a way that fits on a single screen. I've attached the JSON to this post for anyone who wants a starting point like this.
I have a few different dashboards that I use to monitor my system. On mobile displays it's hard to get things to fit in properly so I just use gauges that sit one under the other. For the main monitor panel I run a kiosk mode Pi display that cycles through dashboards. On my desktop I have large ones with all the data
Similar threads
- Replies
- 9
- Views
- 446
- Replies
- 9
- Views
- 460
- Replies
- 1
- Views
- 386
- Replies
- 3
- Views
- 152


