Guda
Superstrut Strut
- Joined
- Nov 19, 2019
- Messages
- 516
Is Ryan a forum member affiliated with Rosen Solar? If so maybe he can fill us in. Do you know his username?


Is Ryan a forum member affiliated with Rosen Solar? If so maybe he can fill us in. Do you know his username?
Operating temperature range, as in you can draw power from it to -20?This battery is good down to -20
I would not have thought there was a difference. What are the defining features of a Powerwall?this is not a battery, its a Powerwall type product.
I think the distinction they are making is that a battery is 'just a battery' whereas a Powerall can be a battery + other goodies, some of which might do things (like heat the cells, or regulate current) to make charging at low (ambient) temperatures more feasible. At least that is how I interpreted it.I would not have thought there was a difference. What are the defining features of a Powerwall?
In that video the Battleborn CEO mentioned +25*F as the lowest charging temperature and with the assumption that it's less than 1C. That is below the normal 32*F limit by 7 degrees but still 45 degrees abvoe -20*FWhen Will interviewed the main dude at Battleborn he said -20 was the new chemistry.
I think this was the video
[emphasis mine]In that video the Battleborn CEO mentioned +25*F as the lowest charging temperature and with the assumption that it's less than 1C. That is below the normal 32*F limit by 7 degrees but still 45 degrees abvoe -20*F
I'm not sure what the full reasoning is, the gist of it is that they feel that based on what they've observed about their average customers use-profile, a slightly lower low temp cutoff is okay. The main reason discussed is that battleborn deemed that their average customer did not charge anywhere near 1C, so they feel a slightly lower charging limit is acceptable in their context. Not sure how much you have looked into low temp charging, but its a 3 way relationship between (1) cell temperature (2) c-rate, and (3) state of charge. We simplify that complex relationship down to the black/white 32*F hard limit, but thats a tiny bit arbitrary as a hard limit, BB just uses a slightly less conservative semi-arbitrary hard limit (note: that BB makes a point of not being overly conservative or complicated, at the probable cost of some cycles, its part of the value proposition to their customers 'set and forget' lifepo4 that you dont have to baby--but if you use it hard within there parameters I'm sure you will see degraded cycle life).[emphasis mine]
due to thermal mass of battery and placement of temperature sensor resulting in the temperature sensor leading rather than lagging the cell material temperature?
I'm not sure what the full reasoning is, the gist of it is that they feel that based on what they've observed about their average customers use-profile, a slightly lower low temp cutoff is okay. The main reason discussed is that battleborn deemed that their average customer did not charge anywhere near 1C, so they feel a slightly lower charging limit is acceptable in their context. Not sure how much you have looked into low temp charging, but its a 3 way relationship between (1) cell temperature (2) c-rate, and (3) state of charge. We simplify that complex relationship down to the black/white 32*F hard limit, but thats a tiny bit arbitrary as a hard limit, BB just uses a slightly less conservative semi-arbitrary hard limit (note: that BB makes a point of not being overly conservative or complicated, at the probable cost of some cycles, its part of the value proposition to their customers 'set and forget' lifepo4 that you dont have to baby--but if you use it hard within there parameters I'm sure you will see degraded cycle life).
The way I prefer to look at it, don't charge at high c-rates at low temperature, and especially not high c-rates, low temperature, and high SOC. 32*F isn't a magic number, damage can occur above or below, but its a reasonable line in the sand. Just know that 1C at 35*F could be worse than 0.1C at 28*F (numbers chosen just for example, not necessarily accurate).
There are some good threads from 2019/2020 where we chewed up the low temp issue half to death if you are interested in it.
edit: and your point/question about thermal mass and temp sensor placement is worth considering as well, not sure if its a factor in BB's reasoning, but it seems to me the opposite could/would be true also. After a very cold night, a temp sensor could register warmth long before the battery warms up.

 diysolarforum.com
")
I briefly skimmed that journal article, but I skipped my regular coffee this morning and am feeling a little slow. I am not sure I am interpreting the results correctly, but it sounds like this experiment had findings that were substantially different from and opposite to what most literature and most manufacturers seem to agree upon. But I have a feeling I am misinterpreting something, or there is a devil in the details of the test parameters or the methodology. The table appears to show a temperature of -20*C / -5*F as having the least capacity degradation. I believe this was for charge/discharge and at a rate of 1C/1C. I can't reconcile this with everything else I've read, unless I am misunderstanding it, which I believe that I am.General LiFePO4 Degradation vs Temperature
Concerned about your LiFePO4 batteries ♨️Overheating♨️ or ❄️Freezing❄️and losing ability to hold charge due to operating temperature? This is a research paper that carries out charging and discharging at set temperatures, and evaluating the...
this research paper really caught my interest on the topic of low temperature charging for LiFePO4 cells.
Tc = temperature of charging : °C
Td = temperature of discharging : °C
DR = degradation rate : (Ah / cycle) / Ah
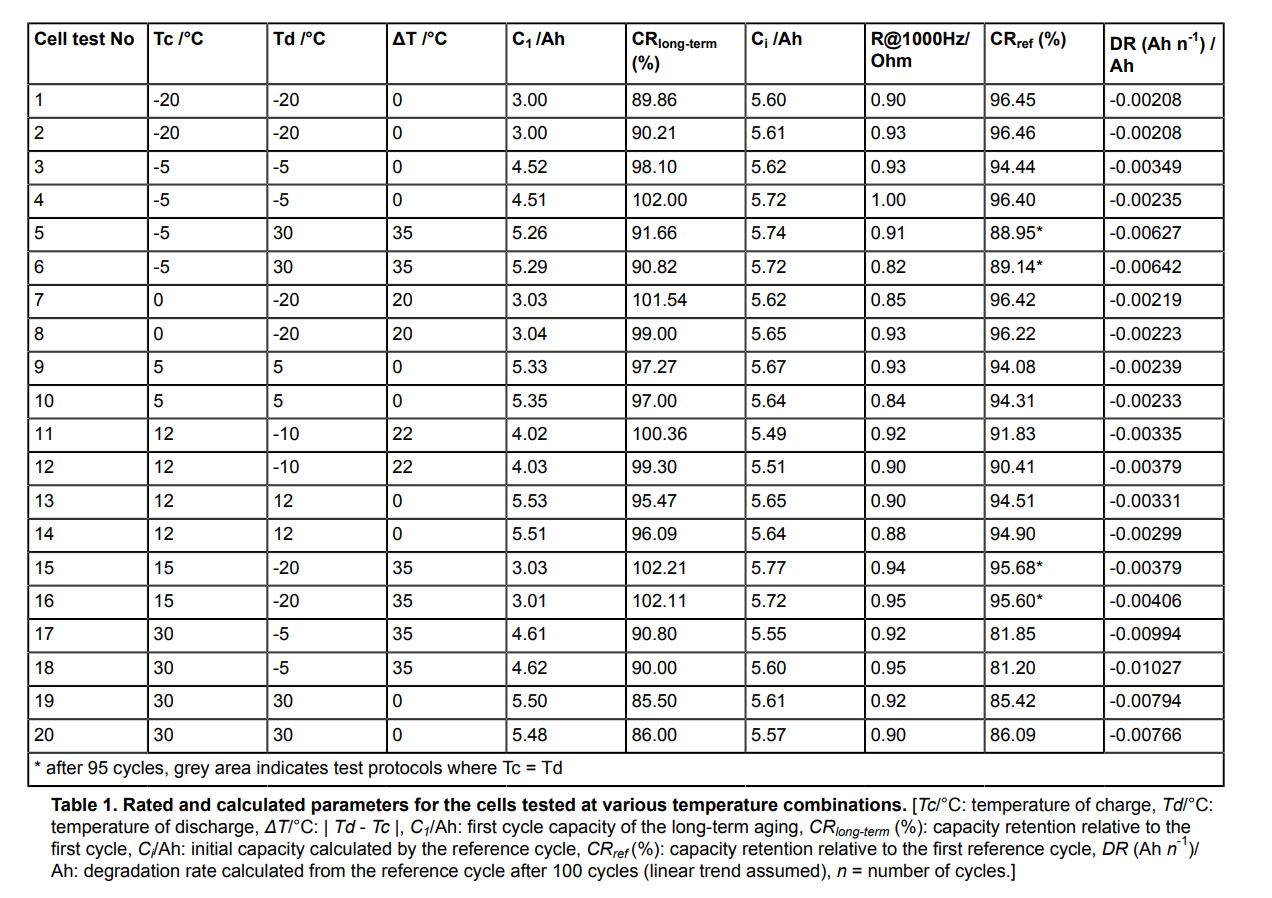
this image paints a more nuanced picture of low temperature charging LiFePO4 than I have heard from most companies. (not that they are "hiding" anything, communicating more than a single cutoff temperature just complicates an already challenging communication task)
some tests are done at same Tc and Td and that is what most users will experience I assume.
the degradation rate of charging at -20°C was -0.00208 Ah/Cycle/AhReferenceCapacity
the degradation rate of charging at +12°C was -0.00315 Ah/Cycle/AhReferenceCapacity
the degradation rate of charging at +30°C was -0.00780 Ah/Cycle/AhReferenceCapacity
normalized, this is:
the degradation rate of charging at -20°C was 1x Rate
the degradation rate of charging at +12°C was 1.5x Rate
the degradation rate of charging at +30°C was 3.75x Rate
many of the lowest DR measures occurred with cold cells. how representative this is of all LiFePO4 chemistries being sold and shipped today, I cannot comment. but it's interesting to me!
Methodology can be (and probably is) sound and still have caveats or specific design parameters that can lead to misinterpretations / misunderstandings by laypeople like me, if we dont fully understand or we mistakenly misapply or overbroaden/overgeneralize the significance of the findings. This is partially what the discussion section of the paper is for, giving contexts to the results, but I didn't it to be that illuminating in this case (was too dense for my quick read, and didn't contextualize the findings against the larger body of research, or at least if it did I skipped over it).1) me too, parsing the data in table form is hard for me, and the paper is difficult for me to parse. 2) agree that 100 cycles might only capture the “beginning of the curve” of degradation and thus apply for the first 100 cycles but may not accurately represent 1000 cycles. 3) i wish to learn more about this concept 4) i need to review the paper more thoroughly to identify issues with the testing methodology, but it did seem fairly rigorous to me at first read.
They seemed to assemble the cells from raw parts and place the cell in a temperature regulated box, and forced the temperature to stay constant, so any self-heating damage ought to be attenuated. I think the device regulated the temperature of the air inside the chamber, they state the model name of the test chamber in the paper.
Basically, I consider the methodology to be sound, but given the number of cycles is only 100, being careful to not automatically extrapolate these degradation rates to the full rated cycle counts of 1000-2000++++
As a summary, it can be concluded that cycling at (-5 °C, -5 °C), (0 °C, -20 °C), (5 °C, 5 °C), (12 °C, -10 °C) and (15 °C, -20 °C) over 100 cycles
led to almost no degradation. The samples tested at Td = -20 °C proved to be stable (recovery in capacity at +25 °C, Figure 4c), making these
samples suitable for sub-room temperature applications. This capacity recovery is less impressive when increasing Tc. The behavior shown by
this set of samples indicates that there is a big component of reversible degradation at low temperatures (kinetic component)
I think this is partially captured by Reference Cycles. Long Term Aging cycles would observe loss associated with both recoverable and non-recoverable loss, but Reference Cycles ought to test higher due to recovery of recoverable type, while of course still missing unrecoverable.One thing that I think needs more unpacking is the 'recoverable' and 'non-recoverable' degradation, and the connection between this summary statement and the chart:
method kill cell:A total of 100 charge/discharge cycles were carried out. Every 25 cycles a reference cycle was performed to assess the reversible and irreversible capacity degradation.
method preserve cell:It was found that the temperature combination for charging at +30 °C and discharging at -5 °C led
to the highest rate of degradation
various quotes about degradationOn the other hand, the cycling in a temperature range from -20 °C to 15 °C (with various combinations of temperatures of charge and discharge), led to a much lower degradation.
The authors of this work described a higher fade in capacity at the higher temperature of discharge, which was attributed to solid electrolyte interface (SEI) layer growth and lithium plating(21) (ref 21 is : Jalkanen, K., et al. Cycle aging of commercial NMC/graphite pouch cells at different temperatures. Applied Energy. 154, 160-172 (2015).)
As a general rule, higher testing temperatures accelerate degradation(1,11,12), enhance the growth of the SEI(11,23,24), and promote variations in the SEI(11,23).
Wang et al.8 published that the fade in capacity followed a power law relationship with the charge throughput (temperatures between 15 °C and 60 °C). Other authors have described a square-root of time relationship with fade in capacity(10,30,31,32,33,34). This is supposed to represent the irreversible capacity loss attributed to the growth of SEI where active lithium is consumed.(30,31)
on calendar agingFinally, some simulations of the fade in capacity at various temperatures were validated with experimental results and the data showed an exponential dependency of degradation and temperature.(8,10)
Capacity degradation also may have a share of linear degradation with time.(33,34,35)
They say Degradation Rate is calculated from Reference Cycle after 100 Long Term Aging cycles.Also I'm struggling to understand (in the chart) CR longterm % vs DR
If I understand correctly DR is the degradation rate per cycle, -20/-20 seems to be among the best here, but CR longterm is the capacity retention after 100 cycles (measured against the initial capacity), and it appears -20/-20 is among the worst in this regard (only better than 30/30). I dont see how both of these things can be true at the same time. Logically, the cells that end with the highest capacity loss would have to also have the highest degradation rate, would they not? I sense that I am missing an important point.

| Term | Name | Unit |
| Tc | Charging Temperature | °Celsius |
| Td | Discharging Temperature | °Celsius |
| ∆T | Charge-Discharge Delta Temperature (Td-Tc) | °Celsius |
| C1 | First cycle capacity of long term aging | Ampere hours |
| CR-longterm | Capacity retention relative to First Cycle | % Percent |
| Ci | Initial capacity calculated by the Reference Cycle | Ampere hours |
| CR-ref | Capacity retention relative to first Reference Cycle | % Percent |
| DR | Degradation rate calculated from Reference Cycle after 100 Long Term Aging Cycles | Ampere hours per cycle per Ah |
A powerwall is a packaged system that includes the battery and all required support circuitry. Systems can include the inverter and chargers. Makes sense a powerwall would include a heating system to permit charging below freezing.I would not have thought there was a difference. What are the defining features of a Powerwall?
When Will interviewed the main dude at Battleborn he said -20 was the new chemistry.
I think this was the video
Last time we saw that claim for charging, it was a typo on the data sheet.This battery is good down to -20
If you open the video on the YouTube site, you can change the speed and/or turn on closed captioning to make it easier to follow.I can hardly understand what the narrator is saying in that video. It's like he's talking into a toilet at warp speed.
I found this thread interesting. My REC active BMS has factory default settings to charge down to -10C... at a reduced charging rate I am told.