Introduction
Grafana is a popular data graphing tool. It can pull in data from a variety of sources and visualize this data in a multitude of graphs and other widgets. Debian and its derivatives (such as Ubuntu) are a popular Linux distribution. In this article, we will set up Grafana, together with
Prometheus and
Node Exporter to form the base of a data visualization system for a wide variety of devices. We will do this on a Debian Virtual Machine, but the process is pretty much the same on Ubuntu and other derivatives or a physical machine. The set-up on Raspberry Pi, while also running a Debian derivative, is slightly different and will be detailed in another post.
Debian
Getting to play with Debian is easiest to do inside a virtual machine, such as
VirtualBox. The good thing is that there are readily available images with Debian
for download. At this time, Debian 11 is the latest version, so this guide will assume we use that one. You don't need the desktop image; the server image (which does not include the graphical user interface and other stuff) will do fine. However, if you feel more comfortable with a full GUI at your disposal, feel free to use it.
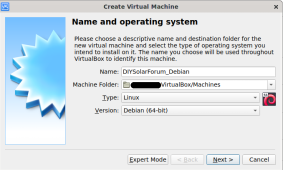
Once you have downloaded your preferred image, extract it. You should have a file ending with .vdi. We have to open it with VirtualBox: create a new virtual machine:

After you click next, you will be asked to give the VM some memory: 4GB should be more than enough. In the next step, you will be asked for a hard disk. This is where the previously downloaded file comes in. Select "Use and existing virtual hard disk image", add the downloaded one to the list, and select it. Then press create.

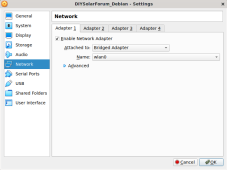
Before you start your VM, make sure you configure your network interfaces: the easiest is probably to pick a bridged network interface (Settings --> Network). This will give the virtual machine an IP address in the same manner any other physical device on your network gets one. This makes life easier.

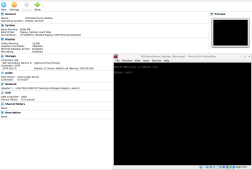
That's it; you can now start the VM:

You can log in with user: root with password: osboxes.org for the root user, and user: osboxes with password osboxes.org. Let's log in as osboxes, in part because we'll connect over SSH in a little while and root is not allowed to do so by default. It's also a good idea in general.
Installation
The first step is to bring the distribution up to date. Run these commands in sequence:
sudo apt update
sudo apt -y upgrade
You will be prompted for a password - it's the same as the one you used to log in. This operation might take some time. After that, you have a fully up to date system.
Ok - little break: typing over commands is painful, and it would be better to just paste these commands. You can't do that directly, so we have to connect to our virtual machine using a program like
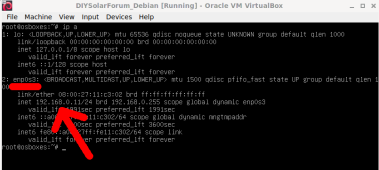
Putty. This enables you to use the SSH protocol to log in to the virtual machine, and copy/paste from the terminal. You also need the ip address of the virtual machine. You get that by using the following command:
ip a

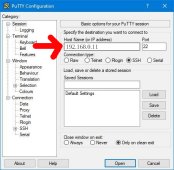
Now you can connect with Putty, and use the same username/password as before:

Once you are connected, any text that you copy on the Windows side, can be pasted in Putty by clicking the right mouse button.
In order to install Grafana and related, you need to first add the Grafana repository so apt can find it. To do that, run the following:
sudo apt install -y apt-transport-https gnupg
sudo apt install -y software-properties-common wget
The following is one line:
wget -q -O - https://packages.grafana.com/gpg.key | sudo apt-key add - echo "deb https://packages.grafana.com/oss/deb stable main" | sudo tee -a /etc/apt/sources.list.d/grafana.list
Newer systems:
sudo mkdir -p /etc/apt/keyrings/
sudo wget -q -O - https://apt.grafana.com/gpg.key | sudo gpg --dearmor > /etc/apt/keyrings/grafana.gpg
The following is one line:
sudo echo "deb [signed-by=/etc/apt/keyrings/grafana.gpg] https://apt.grafana.com stable main" | sudo tee /etc/apt/sources.list.d/grafana.list
Followed by:
sudo apt update
Now we can install the required packages:
sudo apt -y install grafana prometheus prometheus-node-exporter
Almost there. Just run the following two commands to make sure it all starts up, and automatically does so at reboot:
sudo /bin/systemctl enable grafana-server
sudo /bin/systemctl start grafana-server
You should now be able to connect to Grafana with a browser on your Windows side of things, with the following url:
http://192.168.0.11:3000/
Where "192.168.0.11" matches the IP address of your virtual machine. You can log in with the username 'admin' and password 'admin'. You'll be prompted to change your default password, but you can also skip that for the time being.
You can also verify that node-exporter is running by visiting this url:
http://192.168.0.11:9100/metrics
Again, make sure you replace the IP address in the snippet above with yours.
Well done, you've now got the basics up and running!
