diy solar

diy solar

Production on Overcast Days

billynoah

New Member
Joined
Nov 16, 2021
Messages
13
When I google "Solar Production on Overcast Days" there is one universal answer that's repeated across a bazillion websites "10 – 25% of their normal power output". Have any of you found this to be true?

I have a brand new system consisting of 20 LG 435W panels (max rated capacity is 8.7kW) and makes around 8.3kW on a sunny day. At first I was experiencing number like 1000W - 2000W during cloudy days which seems in line with the 10 - 25% estimate. However, in the last week I've had two cloudy days and they are barely making over 300W. Right at this moment the array output is 322W and it's 11 am.

Does this seem normal?
 
Sounds about right, but there is different amount and types of overcast.

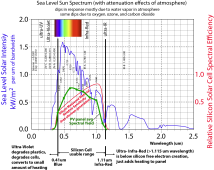
Heavy, low altitude clouds are worse. High altitude cloud overcast less so. About 35% of peak output power from silicon PV cells is in IR range below what you can see. You can feel it as heat on your skin, though.

During winter months, in northern hemisphere, with lower maximum sun angle above horizon there is more atmosphere to go through with more attenuation.

Sun spectral intensity.png
 
Last edited:
I can only give you anecdotal evidence from my systems in Western WA, but:

Driveway lights - 300w of panel, 200 on MPPT, 100 on PWM, 35Ah AGM, 120Wh/day draw. Needs a jump start from the Jackery every 3-5 weeks because it can't keep up Nov-March.

Shed lights - 200w of panel, MPPT controller, inverter with 5w standby draw, 120Ah FLA battery. Needs the battery charger plugged in every 3-4 weeks when the low voltage alarm goes off.

Thanks but I am only vaguely grasping this. Can you break down those numbers in terms an absolute beginner can understand?
 
Thanks but I am only vaguely grasping this. Can you break down those numbers in terms an absolute beginner can understand?
Sure, let me try to grok this out...

Driveway lights (300w of panel), assuming 4 hours of sun per day capable of producing 1200Wh per day. I use 120Wh/day and the panels can't keep up, so less than 10% production.

Shed (200w of panel) assuming 4 hours of sun capable of producing 800Wh. I use 120Wh/day and the panels can't keep up. Less than 7% production per day.

Rough napkin math here. Last time I was home was Nov 4 to Dec 22nd and I saw the actual sun for less than 5 hours cumulatively that entire time. Yes, I kept track.

What you're seeing doesn't sound surprising at all, especially if it's low dark clouds as opposed to the higher brighter clouds that make you squint in the glare. The other question would be on the panel arrangement. Are they all facing the same way and angle or are they spread out? If they're spread out facing SW and S and SE then you should be producing all day long which helps mitigate the hit. If they're all mounted together and facing the same way and tilt you're only going to get a very narrow window of production. If that window is right in the middle of a rain storm, your panels are going to have a hard time making anything happen.
 
Yes its true. I have a 13kw PV array and last December I had 14 days below 7kwh and 1 day was 3.2kwh and 1 day was only 0.3kwh for the whole day! My max is 80kwh in spring/ideal conditions.

7kwh = 9% of 80kwh max. 0.3kwh is an outlier but still is = 0.04%.

Heavy storms + heavy clouds can severely cripple PV generation. In fact this December was the worst I've had in 3 years of operation - e.g. 14days!!!! - and so I'm noodling on what to do as no battery can span that many days.
 
Thanks everyone for your responses. @Rednecktek - that explanation really helps. And yes, the panels are on a tilt rack - all facing south. Best day I've had so far made around 61kWh. Worst was 2kWh! I had no idea the production could vary that much.

Indeed it's rainy and earlier was a pretty serious mist so definitely low lying clouds and water vapor everywhere. Sounds like everything I'm seeing is as pretty normal based on what the three of you have described. What's surprising to me is that there are so few public FAQs out there describing this behaviour.
It's very rare that my 10.2KWp system goes down to putting out 130-160W in the midday sun. I have had rain falling and it's cloudy and yet the power is at 700-800W. I have found that is has to be one of those deep dark cloudy days before things get to under 200W. I have been keeping records and 7 months of operation I have only had 3 such days. I have only had 4 days when my 21KWh packs have not charged to full.
 
Thanks.
I'm working on a spreadsheet using watt-hours of energy (so voltage independent) that assumes full power for 5 hrs & no power for 19 hrs.

Now I can add full for 5, none for 12, and sqrt(10x 25) of full power for the remaining 7.
 

I’m already chasing my tail.
If you’re up on spreadsheets,
here’s revision 1 of mine.


working copy
assuming panel =>charger=>batteries=>inverter=> AC load
assuming the batts charge while the load is powered
ent load R =30ohms
ent load V =120volts
P=(V^2)/R
calc P = 480watts
ent batt disch time12hours
w-h = P x hrs
calc input charge5760w-h
ent batt eff70percent
Act inp w-h = w-h x 100/eff
calc actual input charge8228.57w-h
for5hrs
=charge I = act A-h/hrs
calc charge rate w1645.714286w
add load w480w
system load w = load w + charge w
=2125.714286w
full pwr = 5500w
hrs of full sun at 100% power5
w-h=27500w-h
hrs of partial sun at 16%7
w-h=6160w-h
source charge w =2805w
compare with 'system load w2125.714286w

Stock up on coffee, pop in your own numbers but keep backup copies. :D
 
In the more general, monthly average sense, I've found PVWatts - https://pvwatts.nrel.gov/pvwatts.php - to be pretty darn close. And you can see what to expect in winter vs spring/summer for your specific location.

In my case (13kw PV in Southern Oregon) its 2100-2200kwh/month spring/summer and 500'ish (318 this year) in dead winter. 500 / 2100 = 24%.
 
In reference to that first response from @RCinFLA - it's really interesting how different types of clouds have such a dramatic effect. The cloud cover today looks very similar to what we had yesterday, but maybe a bit higher with less fog. Today looks similarly dim, 100% overcast and snowing yet we're making avg of 2000W compared to 250W yesterday.
 
In reference to that first response from @RCinFLA - it's really interesting how different types of clouds have such a dramatic effect. The cloud cover today looks very similar to what we had yesterday, but maybe a bit higher with less fog. Today looks similarly dim, 100% overcast and snowing yet we're making avg of 2000W compared to 250W yesterday.
Agreed. The cloud layers can be 'thinner' or 'very thick' but look the same from the ground. Very thick + rain is usually bad.

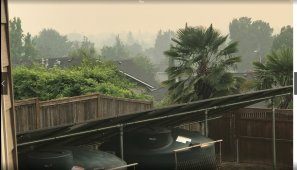
And in Southern Oregon we've had a few summers in a row with dramatically thick *smoke* from wildfires that covers hundreds of miles - cuts PV production significantly. This is from last summer. PV this day was 45kwh/day instead of a normal 75kwh/day (on 13kw PV array).
1645639109033.png
 
Last edited:

diy solar

diy solar
Back
Top