I'm trying to load the .CSV files from Andy (offgrid garage) into the EB Tester software V1.8.5 (I don't have the unit yet).
I've tried both the old and new files he provides. Difference is in the header of the files.
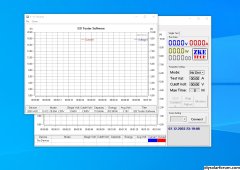
What I've tried is to download the .CSV files, in the software I've choosen File -> Open data -> Curve Type is V-A-Second. And then in the new window that pops up I've selected File -> Open Data and selected Andys .cvs file. But there's no visible curves? Only the header info from the .csv file is presented in the bottom of the window.
Any clue as to what I'm doing wrong?
I've tried both the old and new files he provides. Difference is in the header of the files.
What I've tried is to download the .CSV files, in the software I've choosen File -> Open data -> Curve Type is V-A-Second. And then in the new window that pops up I've selected File -> Open Data and selected Andys .cvs file. But there's no visible curves? Only the header info from the .csv file is presented in the bottom of the window.
Any clue as to what I'm doing wrong?