diy solar

diy solar

How to find/figure out SOC Percentages in the Cell Spec Sheet?

bass-o-matic

New Member
Joined
Oct 26, 2023
Messages
62
Location
Austin, Texas
In the interest of understanding... I have an OverKill 120A BMS and 4 280AH EVE Cells. I got the pack all built. I'm working on understanding and configuring the BMS.

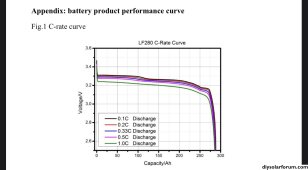
Support at Overkill gave me these values that they got from the Cell Spec Sheet ( attached ). I just want to learn here... How did he get this out of the spec sheet? I don't see them. In my mind... if the max V the Cell can take is 365... then 90% is ... 3285,and 80% is 2920 .... So I clearly don't get it. Educate me please! Thanks

( I have many questions but I'm going to ask each on in it's own post to keep it tidy. )
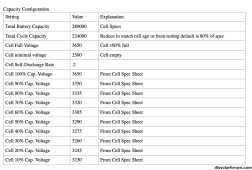
Screenshot 2023-11-14 at 10.41.05 PM.png
 

Attachments

  • EVE Cells.pdf
    1.5 MB · Views: 6
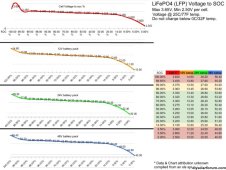
Didn’t they just copy off the Y axis from the voltage to capacity curve?

How did you do your math, straight linear % of voltage? That does not work for LFP.

Not from your PDF since I don’t open random PDF attachments.

IMG_3405.jpeg
 
So you look at this curve and the exact numbers are guess work? I mean how did he come up with 3335 for 80%...

You're right. this is all I really saw in the PDF regarding anything like percentages.
 
In LFP, cell voltages don't mean a lot wrt the SOC.
Especially in the range 10% to 90%

A cell could be 50% full whilst another cell with the exact same voltage could be 75% full.
 
So you look at this curve and the exact numbers are guess work? I mean how did he come up with 3335 for 80%...

You're right. this is all I really saw in the PDF regarding anything like percentages.
The exact numbers are in the graph if you line it up. There is no guesswork other than the data being annoying to read out from graph form
 
I think the capacity voltage numbers are just to get you going. Once the battery charges up it will set to 100% and count the current draw to determine the SOC. I just looked at my battery and the cells are at 3.295V and the capacity says 33% (my numbers would put it closer to 65% on the BMS). I think those number come into affect when the BMS is guessing, rather than counting down from a full charge. When you change settings the BMS will reset and you'll see a SOC% change that may surprise you.
 
Thanks. What kind of error can happen if you attempt to uuse C-rate curve instead of a SoC/capacity curve?
To me, it looks like it is showing the voltage sag (below resting voltage) for various C rate discharges.
So the higher the discharge C rate, the more voltage sag below resting SoC/voltage (aka actual voltage/SoC as far was i am concerned).
 
To me, it looks like it is showing the voltage sag (below resting voltage) for various C rate discharges.
So the higher the discharge C rate, the more voltage sag below resting SoC/voltage (aka actual voltage/SoC as far was i am concerned).
OK. How is the SoC/Voltage graph used if the C rate varies? Is there a parameter in the BMS somewhere for correction factor?

(I mean for the parts of the curve where voltage is useful. Which is very little for LFP. Let's assume I'm asking about a different chemistry, if that makes the question more accessible/less dumb sounding)
 

diy solar

diy solar
Back
Top