diy solar

diy solar

Solaredge system not working properly?

Solarwedge

New Member
Joined
Apr 10, 2023
Messages
15
Location
Holland
Dear all,

An installer set up a Solaredge system on my roof in February this year.

Everything seems to be working fine.

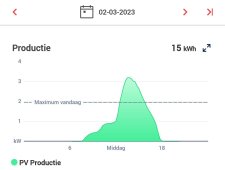
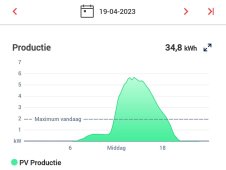
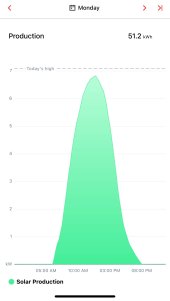
However, I can't help but notice the weirdly shaped production curves I see on sunny days. I always thought they should look more evenly, like a parabola.

Some examples:
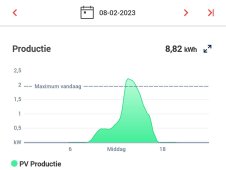
2.jpeg

3.jpeg

4.jpeg

I asked my installer about this, but he says the whole system is fine and I shouldn't worry about it.

But I wonder, is he correct?
 
Clearly shading I'm the beginning of the day.
Take pictures between 10-11 to see ho many panels are shaded.
If none of them are shaded, there is another issue.
How many panels/optimizers and how many watts are your panels?
Does it add up to 5500 watts?
 
There are 27 panels, 350 watts each. 9450 watts total.
s440 optimizers.
SE7K inverter.

12 panels South-East (with a big tree in front of them)
7 panels South-West
8 panels North-West

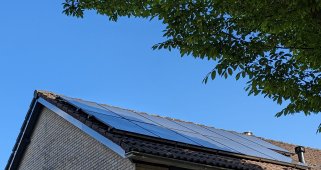
This is a picture I took this morning:

house.jpeg

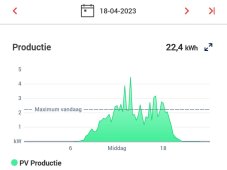
The weird thing is, on a cloudy day the system seems to produce more in the morning. (Not overall, only in the morning.)

Take a look:

18-4.jpeg

It clearly surpasses the 1 kW line, where on 19-4-2023 (the day after, see previous post) it stays beneath that line.
 
It's not weird at all, on a cloudy day the clouds diffuse the light so you get a more even spread of light, so long as the clouds aren't too thick.

On a bright sunny day the light is direct, and the tree shades your panels.

If you dig around in the dashboard you can see what each individual panel is doing, it makes for some interesting graphs, on mine I can clearly see when the boiler flue shades two panels.
 
So the tree shading explains the delay in the morning. All your non south orientation doesn't help either. Your 9450 watt should be highest around noon if all panels would be south facing, 25C ambient temperature and light of 1000 lumens/sq meter. Graph shows just over half. Your RoI is limited, I hope that was explained before you bought the system.
 
It's not weird at all, on a cloudy day the clouds diffuse the light so you get a more even spread of light, so long as the clouds aren't too thick.

On a bright sunny day the light is direct, and the tree shades your panels.

If you dig around in the dashboard you can see what each individual panel is doing, it makes for some interesting graphs, on mine I can clearly see when the boiler flue shades two panels.
Beforehand I was told that a Solaredge system with optimizers would give me 100% production from the panels in the sun. When I compare these two graphs, this doesn't look like that?

So the tree shading explains the delay in the morning. All your non south orientation doesn't help either. Your 9450 watt should be highest around noon if all panels would be south facing, 25C ambient temperature and light of 1000 lumens/sq meter. Graph shows just over half. Your RoI is limited, I hope that was explained before you bought the system.
The installer made a report in Solaredge designer. It showed an annual production of 7200 kWh. With 9450 watts, that's a factor 0,76. I didn't think that was too bad.

In comparison, my South-West facing Sunny Boy system of 2720 watts produces 2200 kWh annually. That's a factor 0,81.
 
All the west facing panels are going to have lower production on the morning. The NW panels specifically are unlikely to produce much of anything until the sun gets high in the sky during the summer afternoon. Any north facing panels aren't going to be good producers.

So in the morning, your only array that faces the sun is shaded. It might be normal considering your array and tree.
 
@Solarwedge if I remember when I get home, I'll post some info which should help you setup some graphs so you can get a better idea of what's going on. Basically you can graph each individual panel, and therefore see what's happening and tie it in with shading etc.

In the app you should also be able to see the layout of your system, and the energy each individual panel has generated, which will give a good indication of which panels are under performing.
 
The installer made a report in Solaredge designer. It showed an annual production of 7200 kWh. With 9450 watts, that's a factor 0,76. I didn't think that was too bad.
I calculate the factor as 7200 / 9.45 = 762 versus what I typically see as 1200 - 1600. That is half what a well designed system facing due South could be producing. Clearly orientations and shade are affecting output. The inverter is doing as good as can be expected under the circumstances.
 
Last edited:
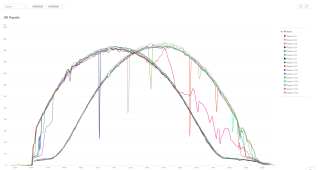
You can create various charts, here's one that shows all panels, I have 8 panels facing one direction, and the other 8 face 90 degree's to them. The two sets are clearly visible below.

1684346686863.png

I believe the big downward spikes on single panels are likely birds, the flue is between panels 9 & 10 at the bottom, and I think affects panel 10 the most.

The point being, creating the charts, and looking at the layout, and taking into account shading, you should be able to get a good idea of if there is a problem.

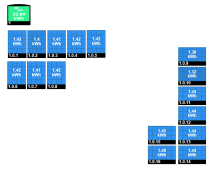
The layout below shows today's totals, its now just gone 19:00.

1684346758184.png


You can also view the layout by daily, weekly, monthly, yearly and total.

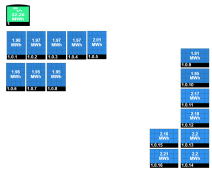
Here's my totals, installed December 2015

1684347131119.png

SolarEdge is very good for analysing each panel, you can drill right down, which should allow you to see if there is a problem somewhere, but shading should always be taken into account. Optimisers don't magically fix shading issues, they just avoid it dragging down the performance of the whole string.
 
Yes I knew that the system wouldn't be as good as a South oriented system.

But a panel is still a panel and produces energy right? Even North East oriented.

I unfortunately don't have space on my South facing roofs.


Could this be the problem here? Voltage blocking?
 
It could be, but you need to create some graphs from your data and you should get a better idea, look at the voltages as well, get a better idea of what is going on at panel level.

I don't speak German so had to read the linked post via Google Translate.

 
But a panel is still a panel and produces energy right? Even North East oriented.
Sure but very much. If you have 2800 watts of panels facing NW the math (at pvwatt.nrel.gov) says the 11:00 am output would be 777 watts on 5/16
You can see the clear bump as the sun gets up and over to that side of the sky, but the peak is 1448 watts, something like 1/2 of the rating for a very short peak.

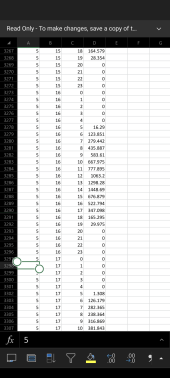
This is a screenshot of the Excel sheet PV watts will output. First column is month, second is date, third is hour. I deleted all the intermediate columns to get it all on one screenshot, so the last is peak watts in that hour (or watt hours)

Screenshot_20230520-074626.png

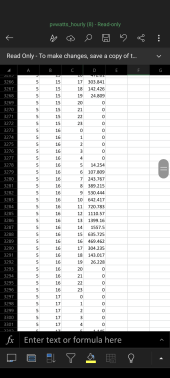
Here's the same for your SW array. Similar but slightly better story.

Screenshot_20230520-075501.png
 
Sure but very much. If you have 2800 watts of panels facing NW the math (at pvwatt.nrel.gov) says the 11:00 am output would be 777 watts on 5/16
You can see the clear bump as the sun gets up and over to that side of the sky, but the peak is 1448 watts, something like 1/2 of the rating for a very short peak.

This is a screenshot of the Excel sheet PV watts will output. First column is month, second is date, third is hour. I deleted all the intermediate columns to get it all on one screenshot, so the last is peak watts in that hour (or watt hours)

View attachment 149919

Here's the same for your SW array. Similar but slightly better story.

View attachment 149921
Thank you. What is your conclusion based on these numbers? Do you mean that you wouldn't have bought the system with these production numbers?
 
Thank you. What is your conclusion based on these numbers? Do you mean that you wouldn't have bought the system with these production numbers?
Not necessarily. If you don't have enough south facing exposure this maybe the best you can do, short of trimming that tree. I was just pointing out that your system output will be low and have that odd shape to the graph.

I'd recommend trimming that tree to get full exposure on your SE facing array.
 
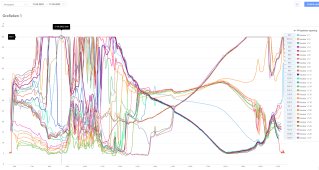
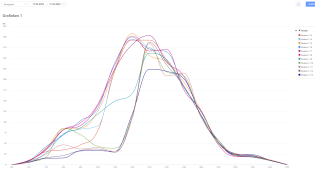
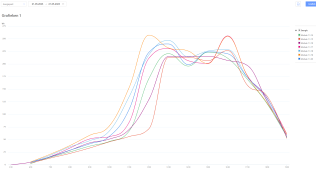
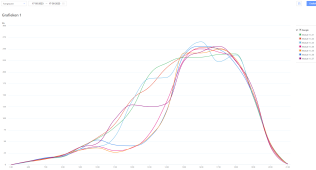
Ok I have some graphs. Can you guys make anything of it?

Below is yearly production, started 6th of Feb this year.
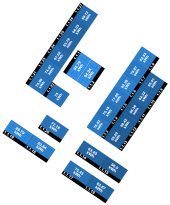
Some panels SW suffer from the shadow of my neighbour's house.
Panels SE suffer from the shadow of a big tree. It's not my tree, so can't cut it down or trim it..

layour.png

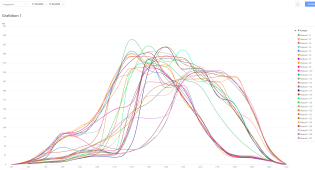
Below production per panel on May 17th (lots of sun the whole day):

17 may production panels.png

Below optimizer voltage on May 17th:

voltage.png
 
Take the energy graph and display only panels from each group. That would be 3-6 graphs depending on how far precious you get with the data.

Looking at the layout, there must be quite a bit fo shading on the south (both SE and SW) facing panels.
 
Back
Top