diy solar

diy solar

State of charge chart

Cell voltage is reliable to determine SoC but cell must be rested and unloaded. ...
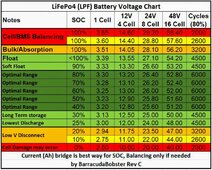
I like the term "Slump" for describing battery voltage drop under load. I have used "Droop" in the past instead of drop or sag but I think I will now use slump instead.

Thanks for the charts. Someone has done a lot of work involved in coming up with them.
 
Just to throw another one in the ring.
The beatings will continue until accuracy prevails!
In fairness this was designed for a 48 volt system. Everything was divided down to the other voltages.
 

Attachments

  • LiFePO4 SOC Charge Chart Rev C.jpg
    LiFePO4 SOC Charge Chart Rev C.jpg
    172.7 KB · Views: 19
I wondered if there was a "Gold Standard" more accurate chart that people use for reference.

Cheers
This chart works fine if you have sufficient battery. Easy to determine when to start the generator or to start extreme conservation.
I assume 48 to 72 hour battery as a minimum.
 
I can only give numbers for our 4 cell 300Ah Sinopoly LiFePO4 battery that has survived 10 years of full time travel.
Two paralleled shunt based battery monitors, Victron SmartShunt and $50 Junctek agree with each other. They are either relatively accurate or less likely both inaccurate by similar degrees.
In daily use I now rarely keep regular track of SOC as the numbers are very similar throughout the days.

If both monitor were to ever fail only a single number would be of concern to me. It may vary slightly between battery makers?
13.1 - 13.3V idling with light loads - everything is fine.
12.7V idling - you have let the battery deplete too far. Time to find a decent charge source now.
Our battery apart from the 700A peak engine starting current has NEVER reached 12.7V.
12.8V has occured once or twice in those 10 years

Click to enlarge
 

Attachments

  • 20230520 NY.jpg
    20230520 NY.jpg
    348 KB · Views: 1
Most of open circuit LFP cell voltage variance is due to self-leakage current rate of given cell and is not much more than a few mV's maximum.

Since LFP cycle life longevity is dominantly set by negative graphite electrode, LFP cells are normally given 15% to 25% more graphite capacity then LFP positive cathode capacity to account for graphite degradation over life of cell. There is also manufacturing tolerances in matching graphite and LFP electrode corresponding thicknesses for matching electrode capacity. The overlap alignment in graphite anode SoC versus LFP cathode SoC can also cause some OCV variance. This can also cause some bracketing overlap shift in pos and neg electrode SoC during cycling, giving the appearance of a cell memory effect.

Overpotential voltage slump has a logarithmic relationship to cell current, so small amount cell current creates a noticeable cell voltage slump.

Rested open circuit cell voltage at 50% SoC will often be a few mV's below 3.300v due to cell self-leakage current flow.

Rested open circuit cell voltage is determined by the LFP positive cathode electrode potential minus the negative graphite potential. This is set by cell chemistry. Any manufacturer specific additives should have very little effect on open circuit voltage.

The cell OCV vs SoC curve on a LFP cell is mostly due to the electrode potential versus SoC of graphite negative electrode. This is due to the way the graphite lattice layers do lithium ion packing of the layers versus state of charge. At full charge, graphite volume expands by about 11% due to the lithium-ion stuffing. This expansion/contraction is the primary life damaging effect on LFP cells.

LPF cathode potential is fairly flat at 3.43 volts until very low SoC. Since graphite negative electrode approaches zero volts of electrode potential at full state of charge it results in a fully charged rested open circuit voltage of LFP cell to be 3.43v which is the chemical potential of the LFP positive cathode.

Both electrodes have their own respective overpotential vs cell current that add together for the net cell overpotential vs cell current. The exponential time lag in the cell voltage equilibrium is primarily due to the time for electrolyte to reach neutral charge equilibrium. For LFP cells, cell voltage equilibrium is achieved in one to three minutes in the 10% to 95% SoC range at 25 degs C. Time to equilibrium gets longer at cooler temperatures as well as low and high states of charge.
LFP Electrode Profiles.pngGraphite Intercalation.png
 
Last edited:
Unfortunately not. I did look at Bluetooth batteries but I just can't justify the cost of them.

To be honest, I can't justify the cost of any of it with what I'm using it for.

Still going to buy it all though. 😀

I was just about to have a look at shunts as it's quite clear that I should be adding one.

I want one with Bluetooth capability to add to victron connect but I also want a screen of some description so that I can instantly see the state of charge.

I'll start investigating now.

Edit** Looks like I'll need the BMV-712.

Cheers
Consider the Victron SmartShunt IP65. It's at a great price right now. I paid more just weeks ago. It's compact, weatherproof, and has bluetooth. I guess the only disadvantage would be that you MUST use the App to see the data. I really like it. It connects almost instantaneously, and I can view the data on my power station (in the basement) from the main level in my house. I have two 12V LIFEPO4 batteries in series and this shunt also measures the mid-point deviation between the two 12V batteries. Not all shunts can do that. You can even set it to notify you when the difference in voltage between the 2 batteries exceed the level you set.
 

Attachments

  • Screenshot_20240309_101153.jpg
    Screenshot_20240309_101153.jpg
    51.6 KB · Views: 3
Back
Top