diy solar

diy solar

Total efficiency from charger through battery and inverter to mains

SIdmouthsteve

New Member
Joined
Jun 30, 2022
Messages
22
I have been looking at my overall efficiency for tariff shifting (charging in the early morning and powering the house from stored charge).

Comparing the power from the mains used to charge my Growatt LifePO4 batteries with the power provided to the house by the batteries shows that for every kWh of charging I get .75 kWh of power. The overall efficiency through the charger, battery and inverter is about 75%.

The 8.5p per kWh that enters my system is actually 11.3p by the time it is used. This is still a very good rate for electricity (Octopus standard daytime charge is 28.5p a kWh).

I am getting about 90% efficiency at each stage. The Growatt SPF5000 inverter is rated at 93% efficiency, the battery charger in the inverter is probably about 90% efficient (I am charging to 90% SOC - efficiency would be better at 80% SOC) and the 4 year old LifePO4 battery stack is probably 95% efficient. 90% sounds good but 0.9*0.9*0.9 is 73% :(.

Roll on summer! Free electricity from the solar panels again :)

Happy Xmas.

NOTE: The discussion below suggests we should expect 80-90% efficiency. My efficiency was lower than should have been expected and I will check the metering etc.

PS: The 60W idle power demand from the inverter doesn't help. My figures were based on metered power in against metered power out so the exact efficiency figures for each stage were educated guesswork. Anyone got exact data?
 
Last edited:
Sounds a bit low to me.... I measured about 85%. LiFePO4's may only hold 90% of their original charge, but that should affect the end-to-end power loss.

What current are you charging at? Do you have other losses with long cable runs?
 
Growatt 5000es has bidirectional charger/inverter circuit and should have similar efficiency both ways. I have not tested it myself but 93% * 96.7% (LFP c/d eff.) * 93% = 83.6%
 
If the battery only holds 90% and the inverter has a 90% efficiency this would only give 81% overall efficiency into the house mains. Or is the battery efficiency usually inclusive of inverter losses?
 
If the battery only holds 90%
That 90% is capacity though, not efficiency.

e.g. If I put a rock in the fuel tank of my BMW so the tank only holds 90% of what it should, I still get the same MPG, I just can't go so far :)
 
Growatt 5000es has bidirectional charger/inverter circuit and should have similar efficiency both ways. I have not tested it myself but 93% * 96.7% (LFP c/d eff.) * 93% = 83.6%
I am charging to 90% which probably knocks a couple of % off the overall charging efficiency and I must have done a 1000 cycles on the batteries - another 5%.
 

Attachments

  • 1702402820185.png
    1702402820185.png
    19.5 KB · Views: 10
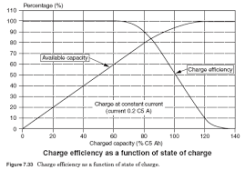
That charge efficiency chart looks like it's for lead-acid battery.
 
Last edited:
That 90% is capacity though, not efficiency.

e.g. If I put a rock in the fuel tank of my BMW so the tank only holds 90% of what it should, I still get the same MPG, I just can't go so far :)
So does the conversion efficiency (95-96%) stay the same throughout the battery's life? I tried a search for this but couldn't get a definitive answer.
 
That 90% is capacity though, not efficiency.

e.g. If I put a rock in the fuel tank of my BMW so the tank only holds 90% of what it should, I still get the same MPG, I just can't go so far :)
Here was Bing's ChatGPT reply: " it is possible that the conversion efficiency of LiFePO4 batteries may change with age. However, I could not find any specific information on this topic."
 
I suspect it is very very small. If you can measure the increase of internal resistance over time, I guess losses within the battery (i.e. creating heat) could be calculated, but my finger-in-the-air guess is that it is insignificant.
 
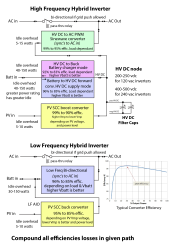
Typical efficiency numbers in diagram below. Efficiency depends on several factors including total power load. For the typical HF SCC boost converter the efficiency is best when PV panel voltage is near maximum allowed voltage input where the boost converter does not have to do much work to boost up voltage to inverter's internal HV DC bus,

On HF inverters, all power flows through the HV DC bus, with exception of AC input to AC output pass-through.

When charging battery from PV you have the efficiency of SCC boost converter times the battery to HV DC converter efficiency. Battery to HV DC converter has the worse efficiency of all blocks and consumes most of the no-load idle current of the inverter.

For HF AIO inverters, there is many ways for marketeers to spin the numbers so they look better than actually achievable in typical usage.

Worst I have seen is spec sheet claiming 99% PV SCC efficiency, Yes, SCC module efficiency can be 99% when PV array Vmp is near maximum allowed input voltage and power level is about 30% of maximum SCC capability, but in order for user to yield anything from the PV SCC output it has to go through sinewave PWM H-bridge chopper to create AC output power or through battery to HV DC converter to charge battery, both of which have their own additional loss. It's a spec wording game.

Inverter power paths.png
 
Last edited:
Conversion efficiency of the battery?
I have just read through some papers on battery efficiency. The key variable is internal resistance. This converts to efficiency according to the load resistance. If the internal resistance is high then if the load resistance is low there will be high losses in the battery. High internal resistance will also affect charging efficiency.

Postscript: The Growatt batteries have an internal resistance of 0.1 ohm. 20 amps at 50V are supplied to 1kW load so the power lost to the battery is 40W - ie: 4%. Hence the 96% conversion efficiency that is widely quoted. LifePO4 batteries increase their internal resistance by approx 20% for every 1000 cycles so, as @SeaGal said above, the age of the battery is not highly significant, affecting capacity more than efficiency.

PPS: The power dissipated in the battery is amps squared times internal resistance so if 40 amps are drawn with a 2kW load then 160W are lost to the battery. This is 8% lost to the battery and 9.6% lost after 1000 cycles so the battery conversion efficiency will fall to 90.4% with a medium aged battery and a high load.

Thanks for making me think. My brain hurts now so I will sign off for the day :)
 
Last edited:
Typical efficiency numbers in diagram below. Efficiency depends on several factors including total power load. For the typical HF SCC boost converter the efficiency is best when PV panel voltage is near maximum allowed voltage input where the boost converter does not have to do much work to boost up voltage to inverter's internal HV DC bus,

On HF inverters, all power flows through the HV DC bus, with exception of AC input to AC output pass-through.

When charging battery from PV you have the efficiency of SCC boost converter times the battery to HV DC converter efficiency. Battery to HV DC converter has the worse efficiency of all blocks and consumes most of the no-load idle current of the inverter.

For HF AIO inverters, there is many ways for marketeers to spin the numbers so they look better than actually achievable in typical usage.
Nice analysis. So the efficiencies for high frequency inverter from utility through to AC output, taking average values:
Batt charge = 0.875
Batt to HV DC = 0.9
DC-AC PWM = 0.97

Multiplied together gives overall 76%. That seems worse than expected and the .96 conversion efficiency of the battery itself is not included. No doubt I have missed something.

The idling power on the inverter, 60-80W, will consume 1.5kWh a day which is 10% of an average 15kWh household consumption. It is beginning to look like an overall efficiency of 70-80% is to be expected for tariff shifting.

Does anyone else have actual measured data of power in versus power out for an overnight battery charged system?
 
Last edited:
I suspect it is very very small. If you can measure the increase of internal resistance over time, I guess losses within the battery (i.e. creating heat) could be calculated, but my finger-in-the-air guess is that it is insignificant.
I did the calculation above.
 
Postscript: The Growatt batteries have an internal resistance of 0.1 ohm. 20 amps at 50V are supplied to 1kW load so the power lost to the battery is 40W - ie: 4%. Hence the 96% conversion efficiency that is widely quoted. LifePO4 batteries increase their internal resistance by approx 20% for every 1000 cycles so, as @SeaGal said above, the age of the battery is not highly significant, affecting capacity more than efficiency.

PPS: The power dissipated in the battery is amps squared times internal resistance so if 40 amps are drawn with a 2kW load then 160W are lost to the battery. This is 8% lost to the battery and 9.6% lost after 1000 cycles so the battery conversion efficiency will fall to 90.4% with a medium aged battery and a high load.
I do not believe the 0.1 ohm value is correct. How did you measure that?

My battery pack will drop only less than 1.2V with a 100A load, which works out about 12 mOhm. That includes the resistance of busbars and wires to the BMS. So, if all the connections had zero resistance, that is well under 0.1mOhm per cell.

If your battery had an internal resistance of 0.1 ohm it would drop 10V at 100A.
 
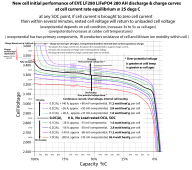
Internal resistance of LFP battery is not its dominate loss. Overpotential voltage slump during discharge and voltage bump up during charging is the dominate loss at moderate cell current. Overpotential (also called polarization voltage) is the overhead power consumed to drive the migration of lithium ions within cell.

For example, a relatively new 280 AH EVE cell, internal ohmic loss is about 0.2 milliohms.

At 56 amps of discharge current there will be 0.63 watt loss due to 0.2 milliiohm ohmic resistance plus about 2.2 watts loss for overpotential slump, for a total cell loss of about 2.8 watts.

Aging and cooler temperatures increases this loss.

LFP is fairly equal in overpotential between discharging or charging current. At 56 amps of discharge and charging, round trip power efficiency is about 96%. (AH round trip efficiency is about 99% on a Columb counter. Difference between power and AH efficiencies is the terminal voltage slump under current.) This is overall cell capacity summation. If you stick to upper 50% of cell SoC the efficiency will be better due to slightly higher cell terminal voltage.

For 6' pair of 1/0 battery cables and cell bus bars at 56 amps, there is 4 watts of loss for cables and 8 watts loss for typical 15 total copper core, nickel plated bus bars and their terminal surface contact resistance (0.05 milliohm for each cell terminal to bus bar contact, 0.07 milliohm each bus bar for 0.17 milliohms total for each bus bar). This is for a 16-cell series stack 48v system.

LF280 AH battery dischg 0.1C-1.0C.png

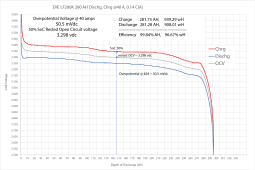
Actual measured cell at 40 amp charge and discharge rates.
EVE LF280K 40A charge_discharge curves.png
 
Last edited:
RC, nice graphs as always.
It looks like at 0.1C total C/D efficiency will be 97.8%.
(1 watt loss per cell) / (3.3V * 28A * 0.5) - 1 = 0.978
 
Internal resistance of LFP battery is not its dominate loss. Overpotential voltage slump during discharge and voltage bump up during charging is the dominate loss at moderate cell current. Overpotential (also called polarization voltage) is the overhead power consumed to drive the migration of lithium ions within cell.

For example, a relatively new 280 AH EVE cell, internal ohmic loss is about 0.2 milliohms.

At 56 amps of discharge current there will be 0.63 watt loss due to 0.2 milliiohm ohmic resistance plus about 2.2 watts loss for overpotential slump, for a total cell loss of about 2.8 watts.

Aging and cooler temperatures increases this loss.

LFP is fairly equal in overpotential between discharging or charging current. At 56 amps of discharge and charging, round trip power efficiency is about 96%. (AH round trip efficiency is about 99% on a Columb counter. Difference between power and AH efficiencies is the terminal voltage slump under current.) This is overall cell capacity summation. If you stick to upper 50% of cell SoC the efficiency will be better due to slightly higher cell terminal voltage.

For 6' pair of 1/0 battery cables and cell bus bars at 56 amps, there is 4 watts of loss for cables and 8 watts loss for typical 15 total copper core, nickel plated bus bars and their terminal surface contact resistance (0.05 milliohm for each cell terminal to bus bar contact, 0.07 milliohm each bus bar for 0.17 milliohms total for each bus bar). This is for a 16-cell series stack 48v system.

View attachment 182632

Actual measured cell at 40 amp charge and discharge rates.
View attachment 182634
Thanks for a very interesting graph and data.

Do I understand correctly that the gap between overpotential rise and overpotential slump at some common reference current such as 0.1C is both an effective way to assess cell-by-cell charge/discharge efficiency (W of heat generation) as well as relative cell health?

I have a 16S2P battery of Eve 380Ah cells which will be unused for several months over winter and I am looking for an easy way to diagnose the health of the battery 2+ years in and whether there are any cells that should be swapped out for spares…

0.1C for my 48V battery is 56A which is a modestly-high current.

Will a similar technique work at 0.02C or even 0.01C? Whatever minimum current allows you to read a reliable voltage difference of 10mV or 20mV (or whatever the minimum sensitivity of your voltmeter is)?

And one final question: is there a way that an AC current can be used to measure an AC voltage at the cell terminals to estimate overpotential or at least relative cell health / internal resistance?
 
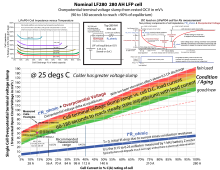
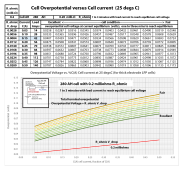
Attached are curves that grade overpotential for given load current versus condition of cell. Overpotential increases with aging condition of cell.

Curves are for temperature close to 25 degs C. Overpotential rises starting about 15 degs C and increases as temp drop lower. Stick between 85% and 25% state of charge for test. Best load current range is between 0.2 and 0.4 C(A), 20-40% of AH rating in amps of load current. You can do it a little lower current but accuracy suffers. Above 0.5 C(A) another effect, layer ionic starvation, becomes an additional factor that increases overpotential more.

Overpotential has a exponential time decay. It takes 1-3 minutes to reach equilibrium. Make sure no-load, open current cell reference voltage has reached steady state and take final voltage slump reading after 3 minutes of load current.

At near end of life, the overpotential can increase 3x to 5x what it was when new. Cell becomes unusable for moderate load current because of excessive terminal voltage slump under load.

Normal DIY'er 'Blue' prismatic cells are thick electrode cells which have greater overpotential due to lithium-ion migration path resistance through thicker electrodes. High peak current cell design has thinner electrodes with greater number of layers for building AH capacity. Thick electrode cells have greater AH for given amount of LFP and graphite but higher overpotential versus cell current.

There is always some manufacturing tolerance on the electrode thicknesses between same model cells.

LF280 overpotiential curve.pngCell Overpotential Chart.png
 
Attached are curves that grade overpotential for given load current versus condition of cell. Overpotential increases with aging condition of cell.

Curves are for temperature close to 25 degs C. Overpotential rises starting about 15 degs C and increases as temp drop lower. Stick between 85% and 25% state of charge for test. Best load current range is between 0.2 and 0.4 C(A), 20-40% of AH rating in amps of load current. You can do it a little lower current but accuracy suffers. Above 0.5 C(A) another effect, layer ionic starvation, becomes an additional factor that increases overpotential more.

Overpotential has a exponential time decay. It takes 1-3 minutes to reach equilibrium. Make sure no-load, open current cell reference voltage has reached steady state and take final voltage slump reading after 3 minutes of load current.

At near end of life, the overpotential can increase 3x to 5x what it was when new. Cell becomes unusable for moderate load current because of excessive terminal voltage slump under load.

Normal DIY'er 'Blue' prismatic cells are thick electrode cells which have greater overpotential due to lithium-ion migration path resistance through thicker electrodes. High peak current cell design has thinner electrodes with greater number of layers for building AH capacity. Thick electrode cells have greater AH for given amount of LFP and graphite but higher overpotential versus cell current.

There is always some manufacturing tolerance on the electrode thicknesses between same model cells.

View attachment 182708View attachment 182700
This is enormously helpful data - thanks.

0.2C = 56A which is not nearly as easy to manage with a bench power supply as 10A (0.036C).

10A only provides ~2mA on an ‘Excellent’ cell (which is noise-level on a basic voltmeter) but increases to ~6-10mA near end of life (which should be measurable).

I suspect my cells will exhibit more than 10mV of overpotential voltage from 10A but that may still provide a useful and easy way to ‘rank’ the health of my cells.

Sounds as though use of AC current is a bad idea and a 3-minute square wave of current would be more useful.

This would be an easy test to perform without disassembling the battery except my 2P cells means that I’m testing a pair of cells at half the signal level.

At least any clearly worse than average cells identified without disassembly would allow the individual cells from any worse-than-average pair to be disassembled and diagnosed individually to see if only one cell from the pair is responsible for the deficient performance.

[EDIT: realize I totally misread the data. The ~2mV increasing to ~6-10mV is only the IR drop.

At 0.05C / 14A the overpotential rise is 25.8mV for an ‘Excellent’ cell increasing to 54.8V for a ‘Fair’ cell and further increasing to 77.4-129mV for cells near End of Life.

Those numbers are all at 25C and will increase above that (my battery is in a basement at ~65F / 18.3C).

Assuming the overpotential rise is linear, an ‘Excellent’ cell at under 25C should have an overpotential rise of over 18.4mV plus an IR drop of another ~2mV for over 20mV total, while the overpotential of a ‘Fair’ cell would increase to 54.8mV for a total rise of over 56.8mV.

And at End-of-Life, Overvoltage Rise at 0.036C / 10A should increase to 55.2 to 92.5mV (for total rise of over 57 to 94mV).

A basic voltmeter should have the ability to measure with 20mV precision, so it seems like this ‘10A 3-minute square wave of current test should be a straightforward way to assess individual cells in terms of degradation.

In fact, since I have monitor measuring all cell voltages in parallel (to 1mV precision), I can charge the full battery with a 10A/3-minute square wave of current to see the overpotential rise off all cells in parallel…

I’m hoping this technique provides an easy way to identify the 1 or 2 cells that have degraded more than the average and hence are limiting overall battery capacity.
 
Last edited:

diy solar

diy solar
Back
Top