You are using an out of date browser. It may not display this or other websites correctly.
You should upgrade or use an alternative browser.
You should upgrade or use an alternative browser.
Total efficiency from charger through battery and inverter to mains
- Thread starter SIdmouthsteve
- Start date
Thanks for a very interesting graph and data.Internal resistance of LFP battery is not its dominate loss. Overpotential voltage slump during discharge and voltage bump up during charging is the dominate loss at moderate cell current. Overpotential (also called polarization voltage) is the overhead power consumed to drive the migration of lithium ions within cell.
For example, a relatively new 280 AH EVE cell, internal ohmic loss is about 0.2 milliohms.
At 56 amps of discharge current there will be 0.63 watt loss due to 0.2 milliiohm ohmic resistance plus about 2.2 watts loss for overpotential slump, for a total cell loss of about 2.8 watts.
Aging and cooler temperatures increases this loss.
LFP is fairly equal in overpotential between discharging or charging current. At 56 amps of discharge and charging, round trip power efficiency is about 96%. (AH round trip efficiency is about 99% on a Columb counter. Difference between power and AH efficiencies is the terminal voltage slump under current.) This is overall cell capacity summation. If you stick to upper 50% of cell SoC the efficiency will be better due to slightly higher cell terminal voltage.
For 6' pair of 1/0 battery cables and cell bus bars at 56 amps, there is 4 watts of loss for cables and 8 watts loss for typical 15 total copper core, nickel plated bus bars and their terminal surface contact resistance (0.05 milliohm for each cell terminal to bus bar contact, 0.07 milliohm each bus bar for 0.17 milliohms total for each bus bar). This is for a 16-cell series stack 48v system.
View attachment 182632
Actual measured cell at 40 amp charge and discharge rates.
View attachment 182634
Do I understand correctly that the gap between overpotential rise and overpotential slump at some common reference current such as 0.1C is both an effective way to assess cell-by-cell charge/discharge efficiency (W of heat generation) as well as relative cell health?
I have a 16S2P battery of Eve 380Ah cells which will be unused for several months over winter and I am looking for an easy way to diagnose the health of the battery 2+ years in and whether there are any cells that should be swapped out for spares…
0.1C for my 48V battery is 56A which is a modestly-high current.
Will a similar technique work at 0.02C or even 0.01C? Whatever minimum current allows you to read a reliable voltage difference of 10mV or 20mV (or whatever the minimum sensitivity of your voltmeter is)?
And one final question: is there a way that an AC current can be used to measure an AC voltage at the cell terminals to estimate overpotential or at least relative cell health / internal resistance?
RCinFLA
Solar Wizard
- Joined
- Jun 21, 2020
- Messages
- 3,564
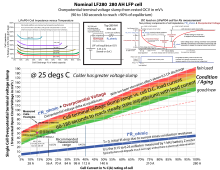
Attached are curves that grade overpotential for given load current versus condition of cell. Overpotential increases with aging condition of cell.
Curves are for temperature close to 25 degs C. Overpotential rises starting about 15 degs C and increases as temp drop lower. Stick between 85% and 25% state of charge for test. Best load current range is between 0.2 and 0.4 C(A), 20-40% of AH rating in amps of load current. You can do it a little lower current but accuracy suffers. Above 0.5 C(A) another effect, layer ionic starvation, becomes an additional factor that increases overpotential more.
Overpotential has a exponential time decay. It takes 1-3 minutes to reach equilibrium. Make sure no-load, open current cell reference voltage has reached steady state and take final voltage slump reading after 3 minutes of load current.
At near end of life, the overpotential can increase 3x to 5x what it was when new. Cell becomes unusable for moderate load current because of excessive terminal voltage slump under load.
Normal DIY'er 'Blue' prismatic cells are thick electrode cells which have greater overpotential due to lithium-ion migration path resistance through thicker electrodes. High peak current cell design has thinner electrodes with greater number of layers for building AH capacity. Thick electrode cells have greater AH for given amount of LFP and graphite but higher overpotential versus cell current.
There is always some manufacturing tolerance on the electrode thicknesses between same model cells.


Did you make these charts yourself? Looks nice.Attached are curves that grade overpotential
This is enormously helpful data - thanks.Attached are curves that grade overpotential for given load current versus condition of cell. Overpotential increases with aging condition of cell.
Curves are for temperature close to 25 degs C. Overpotential rises starting about 15 degs C and increases as temp drop lower. Stick between 85% and 25% state of charge for test. Best load current range is between 0.2 and 0.4 C(A), 20-40% of AH rating in amps of load current. You can do it a little lower current but accuracy suffers. Above 0.5 C(A) another effect, layer ionic starvation, becomes an additional factor that increases overpotential more.
Overpotential has a exponential time decay. It takes 1-3 minutes to reach equilibrium. Make sure no-load, open current cell reference voltage has reached steady state and take final voltage slump reading after 3 minutes of load current.
At near end of life, the overpotential can increase 3x to 5x what it was when new. Cell becomes unusable for moderate load current because of excessive terminal voltage slump under load.
Normal DIY'er 'Blue' prismatic cells are thick electrode cells which have greater overpotential due to lithium-ion migration path resistance through thicker electrodes. High peak current cell design has thinner electrodes with greater number of layers for building AH capacity. Thick electrode cells have greater AH for given amount of LFP and graphite but higher overpotential versus cell current.
There is always some manufacturing tolerance on the electrode thicknesses between same model cells.
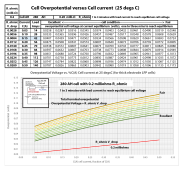
View attachment 182708View attachment 182700
0.2C = 56A which is not nearly as easy to manage with a bench power supply as 10A (0.036C).
10A only provides ~2mA on an ‘Excellent’ cell (which is noise-level on a basic voltmeter) but increases to ~6-10mA near end of life (which should be measurable).
I suspect my cells will exhibit more than 10mV of overpotential voltage from 10A but that may still provide a useful and easy way to ‘rank’ the health of my cells.
Sounds as though use of AC current is a bad idea and a 3-minute square wave of current would be more useful.
This would be an easy test to perform without disassembling the battery except my 2P cells means that I’m testing a pair of cells at half the signal level.
At least any clearly worse than average cells identified without disassembly would allow the individual cells from any worse-than-average pair to be disassembled and diagnosed individually to see if only one cell from the pair is responsible for the deficient performance.
[EDIT: realize I totally misread the data. The ~2mV increasing to ~6-10mV is only the IR drop.
At 0.05C / 14A the overpotential rise is 25.8mV for an ‘Excellent’ cell increasing to 54.8V for a ‘Fair’ cell and further increasing to 77.4-129mV for cells near End of Life.
Those numbers are all at 25C and will increase above that (my battery is in a basement at ~65F / 18.3C).
Assuming the overpotential rise is linear, an ‘Excellent’ cell at under 25C should have an overpotential rise of over 18.4mV plus an IR drop of another ~2mV for over 20mV total, while the overpotential of a ‘Fair’ cell would increase to 54.8mV for a total rise of over 56.8mV.
And at End-of-Life, Overvoltage Rise at 0.036C / 10A should increase to 55.2 to 92.5mV (for total rise of over 57 to 94mV).
A basic voltmeter should have the ability to measure with 20mV precision, so it seems like this ‘10A 3-minute square wave of current test should be a straightforward way to assess individual cells in terms of degradation.
In fact, since I have monitor measuring all cell voltages in parallel (to 1mV precision), I can charge the full battery with a 10A/3-minute square wave of current to see the overpotential rise off all cells in parallel…
I’m hoping this technique provides an easy way to identify the 1 or 2 cells that have degraded more than the average and hence are limiting overall battery capacity.
Last edited:
RCinFLA
Solar Wizard
- Joined
- Jun 21, 2020
- Messages
- 3,564
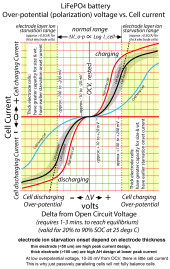
Overpotential , at least up to current level where layer ion starvation effects come into play, has a logarithmic relation to cell current.
There is 10-20 mV of overpotential for very small cell current. This is why just passively parallelling cells will not fully balance their state of charge, and why you need to get up to 0.1 to 0.2 C(A) current to get a good evaluation of overpotential.
Only 10 amps on a 280 AH cell is not going to give a good evaluation of cell state of health.
General curve of overpotential vs cell current follows this graph's trend.

Very helpful, thanks (you saved me wasting a bunch of time and effort).Overpotential , at least up to current level where layer ion starvation effects come into play, has a logarithmic relation to cell current.
There is 10-20 mV of overpotential for very small cell current. This is why just passively parallelling cells will not fully balance their state of charge, and why you need to get up to 0.1 to 0.2 C(A) current to get a good evaluation of overpotential.
Only 10 amps on a 280 AH cell is not going to give a good evaluation of cell state of health.
General curve of overpotential vs cell current follows this graph's trend.
View attachment 182772
I don’t have any easy way to charge or discharge a constant 0.1-0.2C (56-112A).
My SCC can charge at a maximum of 44A / 0.16C per cell or 0.08C per cell pair or full battery) during peak portion of the day, so by turning on and off the breaker on 3-minute intervals, I should be able to estimate overvoltage rise potential at ~0.08C.
Maxing out my inverters can drain ~77A / 0.14C at the battery-level, so cycling those on and off at a 3-minute interval should allow me to estimate overvoltage slump potehtial.
Will need to wait for a crystal-clear summer day to charge the battery at 0.08C but at least there is a path forward.
vaniusha92
New Member
T
Similar threads
- Replies
- 18
- Views
- 386
- Replies
- 39
- Views
- 1K
- Replies
- 9
- Views
- 580
- Replies
- 5
- Views
- 331


