diy solar

diy solar

High Settlement Bill with Solar PV System and Battery Back Up

macanchan

New Member
Joined
Feb 19, 2024
Messages
15
Location
Orange County
Hello,
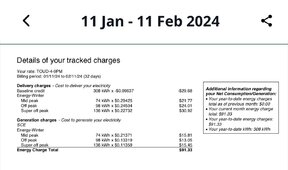
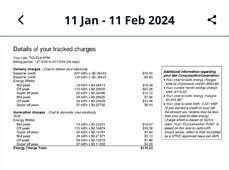
I've had my 6.4kwh solar pv and 16kwh battery back up/critical loads installed over a year ago, I noticed last month my settlement bill was $1000.

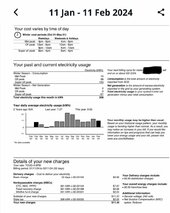
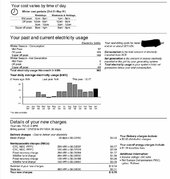
I checked electricity bill and the net generation seemed unusually low. SCE also said my total consumption for 2023 was 3221kwh. I also checked my SMA sunny portal and the net generation was much higher. Is my battery discharge and direct consumption being metered? How do I fix this?

Here's a list of my system:
(16) Hanwah Q Cells Q Peak Duo BLK ML-G10+ 400
SMA SB6.0-1SP-US-41 Inverter
SMA SBS-ABU-200-US-10 Automatic Backup Unit Inverter
Wattnode Modbus RTU 0
LG Chem Resu 16H Battery

New Battery Backup Panel with 3 breakers relocated from main house panel.
Existing Subpanel also connected to battery backup.

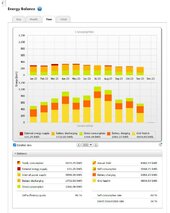
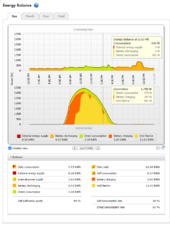
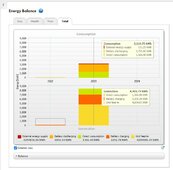
Attached is a screenshot of my SMA Sunny Portal energy balance:
Consumption
Total 3219.75 kwh
external energy supply 121.25 kwh
battery discharge 1732.02 kwh
direct consumption 1366.48 kwh

Generation
Total 8402.74 kwh
direct consumption 1366.48 kwh
battery charging 2202.24 kwh
grid feed-in 4834.03 kwh
 

Attachments

  • Energy Balance.jpg
    Energy Balance.jpg
    100.2 KB · Views: 19
Last edited:
I also checked my SMA sunny portal and the net generation was much higher.
You are probably comparing SCE's recorded net exports with your own recorded generation.

You consume some of the generation immediately to serve the loads in your house while the solar is generating. So exports will naturally be significantly less than total generation.

SCE can't see your total generation or total consumption. Only your imports and exports.
 
I’ve attached my last two months statement info. Does it look correct for my 6.5kwh and battery system? It shows a lot of consumption during super off peak when my battery is discharging…
 

Attachments

  • IMG_1856.jpeg
    IMG_1856.jpeg
    162.6 KB · Views: 37
  • IMG_1855.jpeg
    IMG_1855.jpeg
    140.7 KB · Views: 36
  • IMG_1854.jpeg
    IMG_1854.jpeg
    244.2 KB · Views: 34
  • IMG_1853.jpeg
    IMG_1853.jpeg
    159.9 KB · Views: 36
You are probably comparing SCE's recorded net exports with your own recorded generation.

You consume some of the generation immediately to serve the loads in your house while the solar is generating. So exports will naturally be significantly less than total generation.

SCE can't see your total generation or total consumption. Only your imports and exports.

Would you mind taking a look at my last two months generation and consumption attachements?

I'm going to call SCE NEM department, but I have to leave a message and have them call back.

Should I try to contact SMA for more info?
 
It all seems believable. Can you describe more about how you use your battery? Super off peak is 8am to 4pm and that would be an odd time to be discharging your battery. If you're doing any daily battery cycling it should be to discharge in 4-9pm.

I had heard grumblings about SCE's daytime super off peak changes. It's certainly not beneficial to solar customers, but it's the reality of the grid now.
 
I’ve attached my last two months statement info. Does it look correct for my 6.5kwh and battery system? It shows a lot of consumption during super off peak when my battery is discharging…
I wouldn't be discharging during super off peak. That's the cheap stuff. Save your battery for super peak times, the expensive electrons.
 
My battery is discharging 4pm-9pm mid peak (winter) and 9pm-8am off peak. Summer is 4pm-9pm peak

During 8am-4pm super-off peak, my battery is charging.
 
Last edited:
Here's another picture with the detailed balance below. I understand that rates went up, I just dont understand how it appears i'm generating more than I use and still be charged $1000.

Any advice on asking SCE NEM the right questions, would be appreciated.
 

Attachments

  • 2023 energy balance.jpg
    2023 energy balance.jpg
    48.7 KB · Views: 27
I haven't used Sunny Portal.

OP's utility bill appears to show net generation only in the month of April, a small amount. All the other months net consumption.

Net generation only super off-peak (daylight when everyone's PV is producing?)
16 kWh is pretty decent size battery, 2.5 hours of production (would like about 6 hours to shift all production)
It ought to be charging when PV produces, taking 100% of PV even while grid supplies loads.
It ought to be discharging into grid during peak, even if no loads.

(The battery and inverter I'm playing with so far is only zeroing import/export, not earning me credits)

6.4 kW might produce 36 kWh in the summer.
Bill shows 21 kWh consumption in summer. No prior year data. Maybe consumption is just too high, PV system too small to supply it.

If PV production is separately monitored, you should be able to figure out total consumption.
I think that's what Energy Balance graph shows, always grid feeding in.
 
Maybe this system has a Critical Loads Panel and the SMA is only measuring power at that point, so everything that's going into the main panel is recorded as "grid feed in".
 
The question is about the billing. Really need a shot of the bill itself.

Looking for the feed in rates paid by SCE and the TOU hours.

Title says 'battery back up' but are you cycling the battery daily to store and use your own power before pulling from the grid? Are you selling back energy from the battery at 4-9 pm?
 
Last edited:
"External Energy Supply" on SMA graph is just a sliver, and total 121.25 kWh for the year.

"Daily Average Electricity Usage" on bill is 12.17 kWh/day, 4442 kWh for the year.

Am I reading both correct? Does SMA have data that would let them see what's drawn from the grid?
 
Am I reading both correct? Does SMA have data that would let them see what's drawn from the grid?
I think we're reaching a conclusion that this SMA chart is coming from some CT's between a CLP and main panel, reading all main panel solar consumption and grid exports together as "grid feed in". And the system looks like it's operating the CLP in some kind of SBU mode. It's doing an impressive job and the CLP is nearly capable of year round off grid.
 
My take away is that $1000 for a years worth of utility service isn’t bad at all.

I’d take that in a heart beat.
 
Rates on bill range from $0.227 + $0.114 = $0.341/kWh to $0.294 + $0.214 = $0.508/kWh.
Widest spread is $0.167/kWh

Hardware for DIY PV costs $0.025/kWh (amortized over 20 years), or turnkey installed system costs $0.10/kWh.

If paying or installation, goal might be to offset higher priced kWh, pay utility for cheap kWh.
If self-installed, cover 100% of usage so only pay minimum fee maybe < $150 per year.

With a battery, goal could be to minimize consumption on-peak, store PV to battery off-peak and export on-peak for a credit that gives you 2x to 3x as many kWh at other times.

Utility estimate for my true-up end of February is $1088. I slipped and used too much electric heat (and pool filtering). Should have gotten gas furnace working and switched to it sooner.


The only indication of lifespan I find is warranty of 10 year and 54 MWh.
54 MWh / 16 kWh = 3375 cycles


Review says installed cost $11k to $15k


If it lasted exactly that long, $0.20/kWh cycled through it. Which is more than the widest $0.167 spread between peak and off-peak.

For my RESU-10H, max discharge rate is 0.5C (5kW from 9.8kW battery), but somewhere I read about 0.33C (or was it less) for longest life.
Keeping discharge (and charge) rate lower should extend life, reducing cost per watt.

Using only for the higher spread of summer rates could also improve payback, unless calendar life limits it.
 
Here is a day chart.

I also contacted SCE to request a meter test.
 

Attachments

  • image (1).png
    image (1).png
    87.3 KB · Views: 15
Last edited:
Back
Top