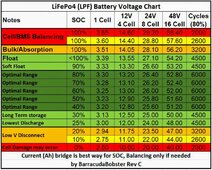
I printed off this chart yesterday just to use for quick reference for my LiFePo4 batteries.
Now there seems to be many of these charts on the net and lots of them give conflicting figures.
There seems to quite a few figures missing.
I wondered if there was a "Gold Standard" more accurate chart that people use for reference.

Cheers
Now there seems to be many of these charts on the net and lots of them give conflicting figures.
There seems to quite a few figures missing.
I wondered if there was a "Gold Standard" more accurate chart that people use for reference.
Cheers