nuke
New Member
Yes, I was going to ask you the same thing.Are you comparing roughly the same states of charge in your screenshots? I don’t understand, I used James way of figuring at the top. 333.7 / 411.4
Yes, I was going to ask you the same thing.Are you comparing roughly the same states of charge in your screenshots? I don’t understand, I used James way of figuring at the top. 333.7 / 411.4
I don't have a scope. I do have CTs measuring real/apparent/reactive power and PF on my critical loads panel so I could try to plot that but it doesn't really tell us if the 18kpv puts out some janky waveformCan anybody with this 80% round-trip efficiency use a current probe and scope to get the current waveform?
My theory is that poor power factor (distorted non-sinewave current, or phase shift relative to voltage) causes additional losses.
i.e. spec'd efficiency might be achieved with a 1.0 PF "real" load like resistive heating element.
Which battery is that and how many of them? Removing LFP cell efficiency of 96.7% you are left with 112 watt phantom load 24/7. Could it be due to BMS power consumption or loss?So far I'm not seeing anything close to 91% efficiency - after 260kwh in, at a similar SOC from this starting point, i'm getting like 210kwh out. That's closer to 80% efficient.
the BMS is supposed to consume far less than that even under full load according to the manualI already suspect that the battery uses about 40 watts an hour. Because when I set the battery to 100% and program it not to discharge. It is about 94-95 % state of charge in the morning
I have an 18kpv and 2 of the EG4 powerprosWhich battery is that and how many of them? Removing LFP cell efficiency of 96.7% you are left with 112 watt phantom load 24/7. Could it be due to BMS power consumption or loss?
That leaves you with 56 watts of phantom equivalent load per battery. BMS series resistance loss is included in that number as well as heater consumption if that battery has it.2 of the EG4 powerpros
I don't think the heater is running at all based on the cell temps (which basically are tracking the ambient temperature, it's not like they're getting cooked).That leaves you with 56 watts of phantom equivalent load per battery. BMS series resistance loss is included in that number as well as heater consumption if that battery has it.
I don't have a scope. I do have CTs measuring real/apparent/reactive power and PF on my critical loads panel so I could try to plot that but it doesn't really tell us if the 18kpv puts out some janky waveform
It has to be included in that total 80% roundtrip efficiency number. I already subtracted it from 56w result.And the 96.7% LFP inefficiency wasn't included in the original post, was it?
I could throw the inverter in an off-grid mode, then watch the reported battery discharge rate vs the measured power (incl power factor) on the LOAD terminals and see if they're congruent?Not its voltage waveform, I'm referring to loads current waveform.
Inverter and battery efficiency would be quoted, probably with resistive load on inverter and constant load on battery. At some < 100% load giving highest efficiency.
Bunch of LED lights, and inverter efficiency would be much worse. Single-phase inverter pulling current waveform of rectified sine wave and battery efficiency is worse.
If ESS efficiency is measured and quoted, I think it will be worse than product of battery and inverter efficiency. Only the same with 3-phase inverter, all phases equally loaded.
"Specs sells" ? ?

How are you measuring this data? Is this DC energy in/out reported by the battery BMS or inverter? Or is this AC in/out from inverter?tl;dr - 71% efficiency
I sample the 18kpv's battery charge and battery discharge sensors every 5 seconds and integrate the curveHow are you measuring this data? Is this DC energy in/out reported by the battery BMS or inverter? Or is this AC in/out from inverter?
My battery soc is set to stop at 20%. I normally discharge all the way down to 20% every night. I have used the 100% soc non discharge about 5 times.Yes, I was going to ask you the same thing.
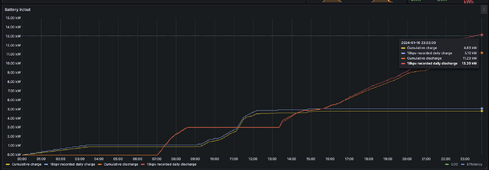
OK, I looked at how my sums compare to what EG4 records as "daily battery discharge".How are you measuring this data? Is this DC energy in/out reported by the battery BMS or inverter? Or is this AC in/out from inverter?

Hmm. I wonder if 5 sec sample rate introduces inaccuracy. Can you compare this to battery BMS kWh in/out data? Edit: i see you last post.I sample the 18kpv's battery charge and battery discharge sensors every 5 seconds and integrate the curve
Yeah, I don't think it's cold enough to necessitate that, but it's also inconsistent. Here's data from the 16th, where the divergence only starts at 7pm?Notice how it tracks until 6am and stops diverging at 8am. This could be battery heater activating.
Perfect timing to preheat the battery right before solar charging starts.

I suppose but I really doubt it given the cell temps, ambient temp, and the fact that I didn't have the firmware that ostensibly turns on the heater outside of charging windowsThe only way to know for sure is to measure heater power consumption and to see if there's correlation with this divergence.
yeah, so 450w total. i dont' see that at play here.Looks like the heater can suck some power. 224W


