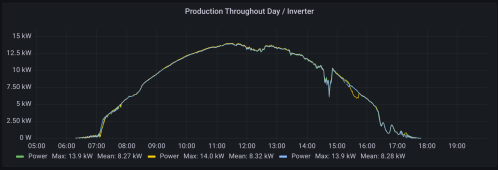
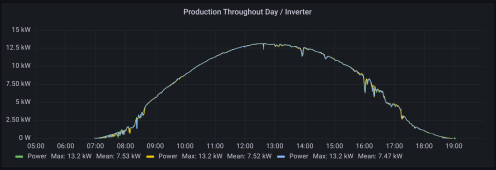
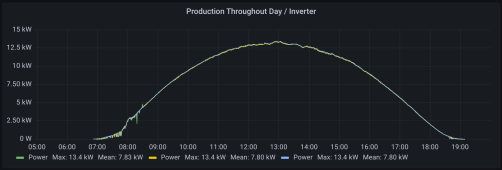
May I ask for the make and model number of those bi-panels?She's been cookin today! Keeps bouncing against max.
32 panels per inverter * 460w each = 14720. So..... The remainder has to come from the bifacial aspect. This is also after any losses from the inverter and wiring as well.
View attachment 138893
View attachment 138894
You are using an out of date browser. It may not display this or other websites correctly.
You should upgrade or use an alternative browser.
You should upgrade or use an alternative browser.
Finally, the start of my 25kw Ground Mount grid-tie system
- Thread starter live4soccer7
- Start date
live4soccer7
Solar Enthusiast
- Joined
- Jun 15, 2020
- Messages
- 670
live4soccer7
Solar Enthusiast
- Joined
- Jun 15, 2020
- Messages
- 670
For anyone curious. The snow is gone now. This is almost a perfect day and much more perfect than my previous "best day" since going live in Oct. The first day, March 7th, the ground was covered in snow. Today, March 17th, there is no snow on the ground. Even though the power production through the day was more perfectly curved and we are 10 days later in the season (higher and more sun) it failed to produce as much as the prior "best day".
March 7th: 286 kWh (ground completely covered in snow)

March 17th: 269 kWh (no snow on the ground)

March 7th: 286 kWh (ground completely covered in snow)

March 17th: 269 kWh (no snow on the ground)

pilotdrh
New Member
Nice. With the snow you reached 10 kW earlier and maintained it longer and your peak was higher. I'd say the bifacial aspect was contributing.
live4soccer7
Solar Enthusiast
- Joined
- Jun 15, 2020
- Messages
- 670
Absolutely. I'm certainly getting bifacial gain now even with the snow gone, but it's more or less giving some sort of comparison between a white ground and natural ground and my light colored rock below/around the arrays.
live4soccer7
Solar Enthusiast
- Joined
- Jun 15, 2020
- Messages
- 670
pilotdrh
New Member
I like the PI just fine. Especially when it came to doing my solar, designed and installed it myself, no permits, no permissions. I lived in FL for 8 months prior to moving here and GA for about 15 years before that. Checkout this link I posted regarding power with shading I was getting today. https://www.facebook.com/groups/849427822349939
live4soccer7
Solar Enthusiast
- Joined
- Jun 15, 2020
- Messages
- 670
live4soccer7
Solar Enthusiast
- Joined
- Jun 15, 2020
- Messages
- 670
hit about 5.7MW this month out of the projected 5.05MW. I think next month's projection is about 6MW.
wattmatters
Solar Wizard
When are you adding more PV? 
live4soccer7
Solar Enthusiast
- Joined
- Jun 15, 2020
- Messages
- 670
If I put up a shop I'd like to put standing seem metal roof on it and put solar on it!
live4soccer7
Solar Enthusiast
- Joined
- Jun 15, 2020
- Messages
- 670
April numbers (wrong, see below):
Projected: 6.3x (don't have the sheet in front of me)
Actual: 6.15
Missed by about 150-200kwh. IMO the month was a bit cloudy. I never had a single "perfect" solar day. I had one that was kinda close. For some reason there were always "whispy" clouds in the sky every single day. I found it a bit strange. I also found the output on the system interesting as well. Just the last few days it got to about 80F. Voltages during high output were down about 50v (expected) and the max AC output was around 12.5kw per inverter where when it was a little colder I would see this around 13-13.5kw and the sun was not as high in the sky. I thought for sure with it being a bit higher 55-60* above horizon it would produce more power due to the angle (my panels mounted at 35*). My best day was 296kwh. Back in march I had a day that was 294kw, so a month later the best day I could get was 296 (somewhat close to perfect solar). I figured it would definitely be over 300 with hopes around summer solstice and a perfect solar day pushing 400kwh.
Edit: Big error on my part!
I was checking to see what I should be producing in may and realized I was a month off for the numbers above (how I managed to install the solar system, idk lol)
April Numbers:
Projected: 5.47MWh
Actual: 6.15MWh
Over Projected: + 680kWh (12.4%)
edit: added "h" where necessary
Last edited:
wattmatters
Solar Wizard
Nice. But you mean MWh and kWh, not MW and kW.April Numbers:
Projected: 5.47MW
Actual: 6.15MW
Over Projected: + 680kW (12.4%)
We experience quite large variations year to year in the production numbers for each month. This April had 7.6% higher production than the average of the previous four Aprils (lowest 894 kWh, highest 994 kWh). We lost a bit of production this month as well with 12 hours of grid outages, with much of it during daytime (= no grid solar PV output).
live4soccer7
Solar Enthusiast
- Joined
- Jun 15, 2020
- Messages
- 670
You just enjoy pointing out my laziness, don't you!?Nice. But you mean MWh and kWh, not MW and kW.
We experience quite large variations year to year in the production numbers for each month. This April had 7.6% higher production than the average of the previous four Aprils (lowest 894 kWh, highest 994 kWh). We lost a bit of production this month as well with 12 hours of grid outages, with much of it during daytime (= no grid solar PV output).
HEck, i doubt it is pedantisim, it is important to know the terms are very different.You just enjoy pointing out my laziness, don't you!?
live4soccer7
Solar Enthusiast
- Joined
- Jun 15, 2020
- Messages
- 670
I understand and I'm just giving him a hard time. He has been here through the entire thread helping.HEck, i doubt it is pedantisim, it is important to know the terms are very different.
wattmatters
Solar Wizard
If there is one thing I know about you and your system, it's certainly not born of laziness!You just enjoy pointing out my laziness, don't you!?
pilotdrh
New Member
Isn't it amazing how much you notice clouds in the sky now?
live4soccer7
Solar Enthusiast
- Joined
- Jun 15, 2020
- Messages
- 670
Alrighty, another monthly performance update on the system.
Projected: 6.37MWh
Produced: 7.87MWh
Overproduced by 23%
Best day in May about 310kWh.
Projected: 6.37MWh
Produced: 7.87MWh
Overproduced by 23%
Best day in May about 310kWh.
Last edited:
wattmatters
Solar Wizard
Nice. We had our best May production since our system was installed in Q2 2018. A fairly cool, dry, sunny month.
Similar threads
- Replies
- 5
- Views
- 422
- Replies
- 4
- Views
- 759


