diy solar

diy solar

NEP Production vs. Sense Production?

dmm

New Member
Joined
Oct 17, 2023
Messages
10
Location
Kutztown
Hello, All... I have a head scratcher (well, for me it is) - any input appreciated. Here is the quandary:

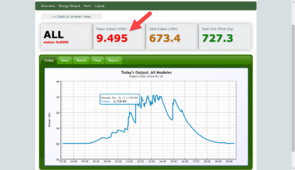
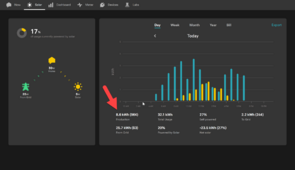
My NEP monitoring system regularly reports a daily KWH output number that is consistently higher (see the end of day report - 1st image, 9.5KWH) by about 8% - 10% than my sense PV Monitor reports (see the 8.6KWH end of day report 2nd image)?

(Production images from today which was very variably cloudy.)

Why?

I do notice that when I check during the day the NEP Monitor is consistently reporting higher instant wattage than the sense monitor (which reports from real-time clamps on the PV fed Breaker)...

1710808139278.png
1710808899193.png
 
Last edited:
My experience with NEP has been only with their new 800 watt (NEP BDM-800) which I purchased at the recommendation of their then CEO Ed Heacox. I also worked with many of their executive team members as I tried to gain solution for my over 50% failure rate within first year. When I realized that I am trapped in their red tape and I valued my time to realize its cheaper option to get rid of NEP and replace with Hoymiles. Zero failure and the micro have completely gone of my mind.

I also recollect that the NEP reported data for production is fake. It consistently reported significantly higher output at other times. However, at around peak production time, around 12:30 pm, their reported data was more accurate. I used an inline voltage and current levels to compare the NEP vs actual output. My output measurements were very close to what SMA Automatic backup unit was reporting as PV production and I started to ignore the PV production as reported by NEP gateway as it was so far from reality.

Sorry but I don't know how fix their highly elevated production levels. @fafrd may have some insights as he is also an BDM-600 user.

Good luck.
 
Last edited:
Hello, All... I have a head scratcher (well, for me it is) - any input appreciated. Here is the quandary:

My NEP monitoring system regularly reports a daily KWH output number that is consistently higher (see the end of day report - 1st image, 9.5KWH) by about 8% - 10% than my sense PV Monitor reports (see the 8.6KWH end of day report 2nd image)?

(Production images from today which was very variably cloudy.)

Why?

I do notice that when I check during the day the NEP Monitor is consistently reporting higher instant wattage than the sense monitor (which reports from real-time clamps on the PV fed Breaker)...

View attachment 202929
View attachment 202931

Which NEP microinverters do you have?
 
It consistently reported significantly higher output at other times.
Thank you - while I have no "uptime" or operate issues, yes the NEP reported KWH (and often "real time" wattage readings) are - shall we say - exaggerated...

I thought I was just looking at something wrong - but your post indicates that NEP have a "rosy" algorithm for the calculations
 
Thank you, BDM 600 (300x2)
Same here. I got mine just as the newest version started shipping in January 2023 - when did you get yours?

NEP’s power output (W instantaneous, not kWh) seems to indicate ‘available input power’ rather than ‘output power’ as labeled.

The BDM600X2s also begin to throttle-back output power to reduce heat when they get too hot during peak hours of the day (if they are overpanelled as they are in my case).

When they throttle, they do so by reducing output current on some duty cycle of what appears to be roughly an 18 second period.

When I watch my utility meter for 2-3 minutes at peak hours on sunny days, I can see instantaneous output kWh cycling down and back up about every 18 seconds.

But in my case, the kWh reported by the gateway on a daily basis appears to tie pretty closely to what my utility meter is reporting for the day.

So I’ve just basically interpreted the W output curves as representing the power available from my panels while the kWh accumulation appears reasonably accurate compared to what my utility is accumulating (no matter how much it may be cycling up and down through peak hours).

Have you ever calibrated your sense monitor against your utility-reported export?

At a minimum, the inverters are measuring the power put out at the far ends of the home run wire while the meter is only measuring power based on the same current but lower AC voltage (voltage drop in the home run wire).

So I use AC current as measured by my clamp meters times AC voltage as measured by my utility meter to reflect the ‘reality’ I’m measuring everyone against…
 
Thank you - while I have no "uptime" or operate issues, yes the NEP reported KWH (and often "real time" wattage readings) are - shall we say - exaggerated...
‘real time’ wattage is certainly optimistic since it seems to be reporting available DC power rather than AC power output, as I indicated.
I thought I was just looking at something wrong - but your post indicates that NEP have a "rosy" algorithm for the calculations.
Something funny appears to happen when the inverters overheat and begin throttling but from what I see, it looks like the gateway is relatively accurately accumulating kWh based on AC voltage at the inverter itself (which will be higher than at the main panel).
 
Same here. I got mine just as the newest version started shipping in January 2023 - when did you get yours?

NEP’s power output (W instantaneous, not kWh) seems to indicate ‘available input power’ rather than ‘output power’ as labeled.

The BDM600X2s also begin to throttle-back output power to reduce heat when they get too hot during peak hours of the day (if they are overpanelled as they are in my case).

When they throttle, they do so by reducing output current on some duty cycle of what appears to be roughly an 18 second period.

When I watch my utility meter for 2-3 minutes at peak hours on sunny days, I can see instantaneous output kWh cycling down and back up about every 18 seconds.

But in my case, the kWh reported by the gateway on a daily basis appears to tie pretty closely to what my utility meter is reporting for the day.

So I’ve just basically interpreted the W output curves as representing the power available from my panels while the kWh accumulation appears reasonably accurate compared to what my utility is accumulating (no matter how much it may be cycling up and down through peak hours).

Have you ever calibrated your sense monitor against your utility-reported export?

At a minimum, the inverters are measuring the power put out at the far ends of the home run wire while the meter is only measuring power based on the same current but lower AC voltage (voltage drop in the home run wire).

So I use AC current as measured by my clamp meters times AC voltage as measured by my utility meter to reflect the ‘reality’ I’m measuring everyone against…
Thank you!!
The BDM 600's were purchased mid 2023 (6 of them). So far I have no heat throttling issues. (I read here about the heat issue, so I modified the mounting brackets by replacing the mounting spacers with longer ones to lower the inverter, creating a larger air gap between the finned top face of the inverter and the underside of the panels.)

I do have a fairly long run to the panel via 12/2 - but the loss I believe the loss should be appx. 1% - which wouldn't account for all of the difference seen in my original post.

I've never "calibrated" the Sense monitor - I can't find the instructions for how one does that.

Your explanation here --- "NEP’s power output (W instantaneous, not kWh) seems to indicate ‘available input power’ rather than ‘output power’ as labeled..." --- seems to be the best explanation

Thank you!!
 
Last edited:
Thank you!!
The BDM 600's were purchased mid 2023 (6 of them).
Should be the same as mine then.
So far I have no heat throttling issues
The only way you can know whether you have the same current throttling I’m seeing is to monitor real-time AC current on your home run wire using a clamp-type current meter.

You can also do this by watching your utility meter for ~3-4 minutes during the peak part of the day.

What size solar panels do you have connected to your BDM600X2s??

(I modified the mounting brackets by replacing the spacers with longer ones to lower the inverter, creating a larger air gap between the finned top face of the inverter and the underside of the panels.)
I’m not sure what ‘spacers’ you are referring to - my brackets are screwed down right into the top of my rails…
I do have a fairly long run to the panel via 12/2 - but the loss I believe the loss should be appx. 1% - which wouldn't account for all of the difference seen in my original post.
Remember that you’ve also got to account for all those BDM trunk cables. Losses in those smaller-gauge wires will almost certainly dominate those in the actual home run.

I don’t think wiring losses can explain your 9% difference but if properly calculated, I’m guessing they’ll cover over a third of it…
I've never "calibrated" the Sense monitor - I can't find the instructions for how one does that.
If your sense is monitoring grid export, just compare what your utility meter reports against what your sense reports. This is obviously a lot easier to do when load is stable / unchanging and it is a clear day…
Your explanation here: "NEP’s power output (W instantaneous, not kWh) seems to indicate ‘available input power’ rather than ‘output power’ as labeled..." --- seems to be the best explanation

Thank you!!
For the instantaneous power being graphed, yes, but it does not explain the accumulated kWh of energy production being accumulated in red (which is what you highlighted).

Do your own estimate of integrating / accumulating energy production from a smooth daily curve some day - you will see the graphed data far exceeds the red accumulated data.
 
I’m not sure what ‘spacers’ you are referring to - my brackets are screwed down right into the top of my rails…
Here is a pic of the tabs to which the NEP provided black rail-bracket attaches - the BDM comes with a hex-bolt threaded through the bracket into these holes - if you buy longer SS hex-bolts and place a SS spacer (something like the spacers shown below) between the mount and these tabs, the inverter will "hang" lower under the rail with a larger air-gap between the top face shown, and the underside of the panel. As far as I know, if this gap is too small, the inverter won't be able to shed the heat radiating through the panel to the finned face shown here.

1710894692845.png

1710895181877.png
 
Last edited:
Here is a pic of the tabs to which the NEP provided black rail-bracket attaches - the BDM comes with a hex-bolt threaded through the bracket into these holes - if you buy longer SS hex-bolts and place a SS spacer (something like the spacers shown below) between the mount and these tabs, the inverter will "hang" lower under the rail with a larger air-gap between the top face shown, and the underside of the panel. As far as I know, if this gap is too small, the inverter won't be able to shed the heat radiating through the panel to the finned face shown here.

View attachment 203125

View attachment 203126
Interesting, thanks. Was there a recommended air gap you were aiming for?

Your BDM600X2s are red, not green, correct? And have max AC current output of 2.46A, right?

The green 300X2 inverters I started with in 2016 only had sustained output of 250W / max output current of 2.08A, while the BDM600X2 inverters I replaced them with last year have maximum output current of 2.46A and max sustained output of 590W.

That 18% higher sustained output makes me very forgiving of any throttling that kicks-in when the inverters are operating at that level…
Sorry, I am running BDM600 (i.e., 300X2) not 600X. These are mine https://northernep.com/wp-content/uploads/2023/10/BDM-600-Datasheet-102623-1.pdf

These are my panels ZnShine ZXM7-SH108-405/M 405w Solar Panel Black frame 108 half cut cells

Yes they are red - since they are on the roof I had to find a pic of the tabs on the internet - the green inverter is just a pic to illustrate what I did...

I didn't target a specific air gap - I think I bought and used 3/4 SS spacers... Because when I test-mounted mounted one, using the "stock" bracket, I noticed how very little air gap there was ... I can imagine the panel's black face-heat radiating into the inverter. I then recalled a thread on this site about heat throttling - to avoid it, I decided to try to "create" a larger air gap as I described above to try to provide more air-insulating or cooling space.
 
Last edited:
Sorry, I am running BDM600 (i.e., 300X2) not 600X. These are mine https://northernep.com/wp-content/uploads/2023/10/BDM-600-Datasheet-102623-1.pdf
Ah, that’s why you may not have any throttling to deal with. Your inverters are capped at 2.09A versus mine that are capped at 2.46…
These are my panels ZnShine ZXM7-SH108-405/M 405w Solar Panel Black frame 108 half cut cells
Nice panels. Definitely overpanelled but because you are limited to 2.09A, overheating should never be an issue.
Yes they are red - since they are on the roof I had to find a pic of the tabs on the internet - the green inverter is just a pic to illustrate what I did...
That’s what I expected.
I didn't target a specific air gap - I think I bought and used 3/4 SS spacers... Because when I test-mounted mounted one, using the "stock" bracket, I noticed how very little air gap there was - I mean it's perhaps 1/4"... I can imagine the panel's black face-heat radiating into the inverter. I then recalled a thread on this site about heat throttling - to avoid it, I decided to try to "create" a larger air gap as I described above to try to provide more air-insulating or cooling space.
1/4” definitely sounds like an issue, so your spacers were a wise move. I have at least 3/4” if not a full inch under my older-generation 335W panels. The frames are 1-1/4” tall which I believe it taller than most new panels these days.

With your overpanelling, you should have a large flatspot on a clear day.

Since you know the sustained current is 2.09A, # BDM600 x 2.09A should e the current you read on your home run wires with a clamp-style ammeter.

If you are only getting 90% of that max current, there may be an issue somewhere.

But if you are getting that full max sustained current, that max current times VAC as reported by your utility meter is the most you can ever get.
 
Since you know the sustained current is 2.09A, # BDM600 x 2.09A should e the current you read on your home run wires with a clamp-style ammeter.
Thank you...

I think your insights are spot on for your math... The good news is that, to date, I think I am getting "max" current out of the BDMs... (the issue is that the BDM's app-reported "output" is consistently higher than actual consumed or panel-fed Sense measures, as discussed above).

And so far I haven't seen a flat spot, but peak summer may reveal that... initial install was September '23

I have 6 BDM 600's deployed on 11 panels (number 6 is fed by 1 panel right now - I will add the 12th soon). My Sense Monitor (from its PV clamps, not the mains clamps) is clamped to the input 12/2 wires at the 20amp BDM-fed fed breaker in the panel.

(Note that Sense provides 4 clamps - 2 on the mains for the panel consumption and 2 on the PV fed breaker for its Solar features and measures.)

To date, on the best days (when I have been around to check), the Sense meter has seen approx 3 to 3.1KW consumed by the breaker at the panel - and when I check with my tool-box clamp ammeter on the 12/2 wire at the junction box, it has indicated 12 to 12.5 amps.
 
Last edited:
Thank you...

I think your insights are spot on for your math... The good news is that, to date, I think I am getting "max" current out of the BDMs... (the issue is that the BDM's app-reported "output" is consistently higher than actual consumed or panel-fed Sense measures, as discussed above).

And so far I haven't seen a flat spot, but peak summer may reveal that... initial install was September '23

I have 6 BDM 600's deployed on 11 panels (number 6 is fed by 1 panel right now - I will add the 12th soon). My Sense Monitor (from its PV clamps, not the mains clamps) is clamped to the input 12/2 wires at the 20amp BDM-fed fed breaker in the panel.

(Note that Sense provides 4 clamps - 2 on the mains for the panel consumption and 2 on the PV fed breaker for its Solar features and measures.)

To date, on the best days (when I have been around to check), the Sense meter has seen approx 3 to 3.1KW consumed by the breaker at the panel - and when I check with my tool-box clamp ammeter on the 12/2 wire at the junction box, it has indicated 12 to 12.5 amps.
I don’t know anything about your sense meter and how accurately it computes Watts from AC current and voltage.

You are doing exactly the correct thing and my advice to you is to focus on the things you can directly measure, meaning AC current and AC voltage.

Because of the missing panel, you won’t be able to max out the 6th inverter and won’t get a true flat spot.

2.09 x 6 = 12.54A and it sounds like you are already getting very close to that despite the missing panel.

The 6th dual Microinverter being fed by a single 405W panel might max out near 90% or 365W at peak production so you might get 365W x 95.5% = ~348W of AC output from that panel on a good day.

At 240VAC of grid voltage, that 384W would translate to 1.6A.

So I’d expect peak current without the 12th panel to peak out at 5 x 2.09A + 1.6A = 12.05A.

From what you’ve indicated, your already there.

My advice would be:

-Ignore Sense for now and get that 12th panel installed.

-Confirm you get a 1-2 hour flatspot of max current output of 12.5AAC through peak hours on a clear day.

That confirms that the inverters are doing what they are rated to do and are operating properly.

Now you want to confirm that your utility meter is properly crediting your solar production.

Grid voltage bounces up and down and typically increases close to 250VAC during peak solar hours (at least where I live), so mapping AAC to Watts is a challenge (let alone estimating Watt Hours).

Your Sense ought to do this for you but you first need to confirm it ties with your utility meter. If the Sense is monitoring grid mains wires and the hourly kWh reported by your utility ties with what the Sense reports, that pretty much confirms it is accurately sampling AAC and VAC to compute Watts.

So then that leaves the whole domain of Power Factor.

Of you have any inductive loads such as a fridge running, they get a ‘free ride’ in terms of power consumption because the reactive power they consume does not figure into the Watts measured by your utility meter and you are not charged for them.

Your NEP600s have power factor correction, meaning they will supply that reactive power rather than the grid, which means the AC current is the same but phase-shifted so that your utility meter and your sense will not count that phase-shifted current component when they calculate Watts.

From what I can see, NEPs monitor is correctly accumulating output power but merely based on AAC x VAC without accounting for any phase-shift between the two caused by Power Factor Correction.

A way you can confirm this would be to shut off all of your inductive loads spanning a peak production hour one day (probably after that last panel has been installed ;)).

If you get kWh data for a peak production hour with resistive loads only (or even no loads if you can shut all breakers down for an hour) from your utility and the Sense and they agree with the kWh product in the NEP monitor reflects at the end of that hour minus the beginning of that hour (only trust the number in red, not the graphed data), you know your NEP microinverters are performing as they should and it is just the shenanigans that goes into how Watts are calculated based on resistive power only that is causing the discrepancy you see.

The way I figured out all of this stuff is that I have battery-powered GTIL inverters that can offset overnight load.

But when I did so, I was very confused to see that my daily net export decreased significantly.

My overnight load is dominated by inductive loads (5 fridges/freezers) and I finally understood that the average 300W consumption my utility was reflecting (and charging me for) was only a portion of the AC current needed to run them.

So once all of that current was being provided by my GTIL inverters rather than the grid, my overnight free ride was over and I had to cover all reactive power consumption from the energy stored in my battery.

Utilities charge ~110% for resistive Watts they measure because they assume ~10% reactive power for residential customers.

So if the ‘gap’ you are seeing between kWh reported by Sense and NEP monitor is 10%, it’s probably mostly that.

Will your Sense report reactive power as well?
 
  • Like
Reactions: dmm
I don’t know anything about your sense meter and how accurately it computes Watts from AC current and voltage.

You are doing exactly the correct thing and my advice to you is to focus on the things you can directly measure, meaning AC current and AC voltage.

Because of the missing panel, you won’t be able to max out the 6th inverter and won’t get a true flat spot.

2.09 x 6 = 12.54A and it sounds like you are already getting very close to that despite the missing panel.

The 6th dual Microinverter being fed by a single 405W panel might max out near 90% or 365W at peak production so you might get 365W x 95.5% = ~348W of AC output from that panel on a good day.

At 240VAC of grid voltage, that 384W would translate to 1.6A.

So I’d expect peak current without the 12th panel to peak out at 5 x 2.09A + 1.6A = 12.05A.

From what you’ve indicated, your already there.

My advice would be:

-Ignore Sense for now and get that 12th panel installed.

-Confirm you get a 1-2 hour flatspot of max current output of 12.5AAC through peak hours on a clear day.

That confirms that the inverters are doing what they are rated to do and are operating properly.

Now you want to confirm that your utility meter is properly crediting your solar production.

Grid voltage bounces up and down and typically increases close to 250VAC during peak solar hours (at least where I live), so mapping AAC to Watts is a challenge (let alone estimating Watt Hours).

Your Sense ought to do this for you but you first need to confirm it ties with your utility meter. If the Sense is monitoring grid mains wires and the hourly kWh reported by your utility ties with what the Sense reports, that pretty much confirms it is accurately sampling AAC and VAC to compute Watts.

So then that leaves the whole domain of Power Factor.

Of you have any inductive loads such as a fridge running, they get a ‘free ride’ in terms of power consumption because the reactive power they consume does not figure into the Watts measured by your utility meter and you are not charged for them.

Your NEP600s have power factor correction, meaning they will supply that reactive power rather than the grid, which means the AC current is the same but phase-shifted so that your utility meter and your sense will not count that phase-shifted current component when they calculate Watts.

From what I can see, NEPs monitor is correctly accumulating output power but merely based on AAC x VAC without accounting for any phase-shift between the two caused by Power Factor Correction.

A way you can confirm this would be to shut off all of your inductive loads spanning a peak production hour one day (probably after that last panel has been installed ;)).

If you get kWh data for a peak production hour with resistive loads only (or even no loads if you can shut all breakers down for an hour) from your utility and the Sense and they agree with the kWh product in the NEP monitor reflects at the end of that hour minus the beginning of that hour (only trust the number in red, not the graphed data), you know your NEP microinverters are performing as they should and it is just the shenanigans that goes into how Watts are calculated based on resistive power only that is causing the discrepancy you see.

The way I figured out all of this stuff is that I have battery-powered GTIL inverters that can offset overnight load.

But when I did so, I was very confused to see that my daily net export decreased significantly.

My overnight load is dominated by inductive loads (5 fridges/freezers) and I finally understood that the average 300W consumption my utility was reflecting (and charging me for) was only a portion of the AC current needed to run them.

So once all of that current was being provided by my GTIL inverters rather than the grid, my overnight free ride was over and I had to cover all reactive power consumption from the energy stored in my battery.

Utilities charge ~110% for resistive Watts they measure because they assume ~10% reactive power for residential customers.

So if the ‘gap’ you are seeing between kWh reported by Sense and NEP monitor is 10%, it’s probably mostly that.

Will your Sense report reactive power as well?
Wow Thank you - it will take some time to absorb this. Give me a few days - in the meantime, thank you
 
Wow Thank you - it will take some time to absorb this. Give me a few days - in the meantime, thank you
N.P. - take your time. I’m just happy another member may benefit from my painful lessons learned…

It was a long and twisted road for me before I finally figured out that the 10-15% ‘gap’ between the current x voltage I was reading at my main panel (which pretty much agreed with what my NEP gateway was accumulating) and what my utility was reporting (which was true watts computed and accumulated by my meter) came largely down to reactive power powering my inductive loads…
 
Back
Top