Darcy Costa Rica
New Member
- Joined
- Jun 3, 2022
- Messages
- 39
I have posted this on another forum, and I am curious what people on this forum think about the problem.
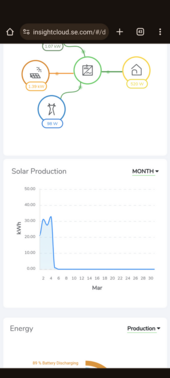
Schneider's Insight Cloud Solar Production report has been broken for two months. Daily solar production graphs are working. Monthly and Yearly graphs show nothing. Zero display of data. It is inconceivable to me that they have broken their cloud software and do not fix it. I am sure there are many Schneider Conext SW Pro users on this forum. Are other people seeing the same problem, or am I the only one?
Has anyone else contacted Schneider about this problem? Did you get any reply that indicates they might be fixing the problem?
Here are some images that show the problem:
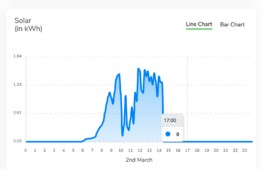
This shows today's graph for Solar Production:

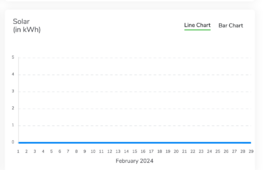
This is the graph for Solar Production for the month of February:

No Data!
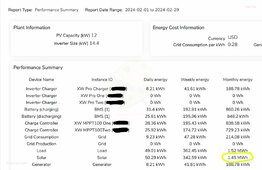
This is the actual production for the month of February:

Any ideas?
Schneider's Insight Cloud Solar Production report has been broken for two months. Daily solar production graphs are working. Monthly and Yearly graphs show nothing. Zero display of data. It is inconceivable to me that they have broken their cloud software and do not fix it. I am sure there are many Schneider Conext SW Pro users on this forum. Are other people seeing the same problem, or am I the only one?
Has anyone else contacted Schneider about this problem? Did you get any reply that indicates they might be fixing the problem?
Here are some images that show the problem:
This shows today's graph for Solar Production:

This is the graph for Solar Production for the month of February:

No Data!
This is the actual production for the month of February:

Any ideas?


