diy solar

diy solar

Solaredge 8kWp system - but never get more than 6kW

sveha

New Member
Joined
Nov 30, 2023
Messages
12
Location
Switzerland
Dear all
Beginning of the year I installed a SolarEdge PV system
20 panels x 400W = 8kWP
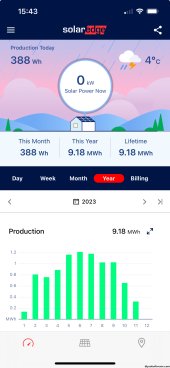
All over the year, I almost never got over 6, max 6.2
never ever even close to 8
solar system is installed to roof, almost perfect orientation SSW and almost perfect angle, no shadow

to be honest, I am disappointed.
Vendor says this is in normal range

Is that true ? What is your experience ?
Can I expect to at least on some good days get let's say to 7.5 ?

THX
Sven
 
I'm guessing you have a 7.6 kW inverter?

Maybe you could use PVWatts web site and put in your location, inverter size, panels, orientation, and see what that shows for production. You can then show the (ideal) production for your location per month and see how that compares to what you are getting for actual.

From the SolarEdge monitoring site (I'm assuming your system is connected to the internet and is reporting), you should be able to see daily, weekly, monthly, yearly production to see what your numbers are. You can also look at the day's production to see if there is any clipping, etc.
 
Dear all
Beginning of the year I installed a SolarEdge PV system
20 panels x 400W = 8kWP
All over the year, I almost never got over 6, max 6.2
never ever even close to 8
solar system is installed to roof, almost perfect orientation SSW and almost perfect angle, no shadow

to be honest, I am disappointed.
Vendor says this is in normal range

Is that true ? What is your experience ?
Can I expect to at least on some good days get let's say to 7.5 ?

THX
Sven
Getting 80% is pretty normal. The 400 watt rating is for laboratory conditions.

I've got 8kw on my 6kw Solar Edge inverter and only rarely see clipping. Today it never broke 5kw.
 
I'm guessing you have a 7.6 kW inverter?

Maybe you could use PVWatts web site and put in your location, inverter size, panels, orientation, and see what that shows for production. You can then show the (ideal) production for your location per month and see how that compares to what you are getting for actual.

From the SolarEdge monitoring site (I'm assuming your system is connected to the internet and is reporting), you should be able to see daily, weekly, monthly, yearly production to see what your numbers are. You can also look at the day's production to see if there is any clipping, etc.
thanks for the help !
Yes I am connected. Is there a simple ID number that I could provide to you so you could have a look ? Apparently you know much better than me...
 
Just as a hint, max daily production likely happened on a clear/cool spring day.

The inverter has a sticker on the side with info including capacity (7,600 watts for example) post a pic of you don't see the capacity.

Just FYI, I've got 7.96 kw on the roof and a 6kw Solar Edge inverter and only see clipping a few days of the year. Most of the time my 8kw produces less than 6kw. Based on the info provided your system looks normal.

Have you put your location and system info into PV watts to see if actually production matches the modeled data? It's pretty accurate for my location.
 
the clipping was June 24. That was really a perfect day in peak summer.
ps - I think I misunderstood. I thought clipping means that I should do a picture of the solar edge application and clip it ... (no native speaker, sorry)
 
I am in Geneva, Switzerland. I completed the form (see attached)
8KW
around 45° roof
SSW
so the performance of my system seems ok if I understand correctly. Right ?
 

Attachments

  • Screenshot 2023-12-01 at 16.14.02.png
    Screenshot 2023-12-01 at 16.14.02.png
    289 KB · Views: 8
ps - I think I misunderstood. I thought clipping means that I should do a picture of the solar edge application and clip it ... (no native speaker, sorry)
Clipping is English solar jargon, not regular English.

It means the system output was capped by the AC output capability of the inverter. It looks like a plateau surrounding mid day.
 
I am in Geneva, Switzerland. I completed the form (see attached)
8KW
around 45° roof
SSW
so the performance of my system seems ok if I understand correctly. Right ?

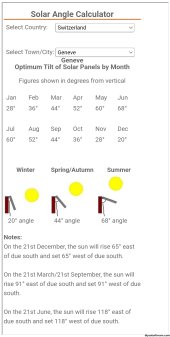
your 45° solar angle is a good middle ground for summer Vs winter (at least in your location)....

BUT it's not the perfect angle for summer, so you might be seeing some reduction in summer production because of this

Screenshot_2023-12-01-15-46-55-732-edit_com.android.chrome.jpg


http://www.solarelectricityhandbook.com/solar-angle-calculator.html
 
Last edited:
This is what clipping looks like. You can see the cut off top of the output. There isn't much lost production in that curve.
Screenshot_20231201-111819.png

I am in Geneva, Switzerland. I completed the form (see attached)
8KW
around 45° roof
SSW
so the performance of my system seems ok if I understand correctly. Right ?
That's what we've been saying the entire time. Sounds about right.
On that page, you can download the daily data and compare in finer detail.
 
I am in Geneva, Switzerland. I completed the form (see attached)
8KW
around 45° roof
SSW
so the performance of my system seems ok if I understand correctly. Right ?
Yeah, so looking at that PVWatts and your actual 2023 output and they look pretty similar, so your system seems to be doing as designed.

With both of my SolarEdge installs the installer over-subscribed the system. My first was 8.55 kw with 7.6 kw inverter (1.125x), and second was 11.9 kw with 7.6 kw inverter (1.56x). I've read that SolarEdge inverters can be DC oversized up to 200%.

On my current system, we did increase the inverter size to 11.4 kw to eek out a bit more from the system (about 8-10 kwh per day best case). I was getting quite a bit of clipping, and system performance was lower than desired. My yearly production was just a bit more than consumption and with the tarriff that we have, I need to produce about 30% more that I consume to break even (so if I happen to consume an extra 100 mWh in a month, I would have to had produced about 130 mWh for it to be revenue neutral). My old house had 1:1 so I woudl just have to produce 100 mWh to offset any extra 100 mWh usage.

I've done some measurements of items in the home and have made some changes to reduce consumption to aide in reaching my goal of paying $0/year for electricity, which was the whole point of the system.
 
My Solar Edge system is connected to 9kw of panels and if I see anything over 7kw it's a good day. Your numbers are pretty normal.

Take a look at the physical layout tab and see if any panel is under performing compared to the others. I've had 3 optimizers fail and while the first two just quit working, the third one was limiting that panel to about 15% of potential.
 
your 45° solar angle is a good middle ground for summer Vs winter (at least in your location)....

BUT it's not the perfect angle for summer, so you might be seeing some reduction in summer production because of this

View attachment 180667


http://www.solarelectricityhandbook.com/solar-angle-calculator.html
Thanks a lot for the information
I can actually see this in my installation. I have a total of 20 solar panels. 16 are installed on the roof with around 45°. 4 are installed on a dormer (is this the correct word ??) and almost horizontal. Those 4 produce less during winter months but more during summer months, in agreement with the angle difference and theory :)
 

diy solar

diy solar
Back
Top