diy solar

diy solar

Emporia energy monitor is lame, can't get the data I want, ESPHome?

Just curious, why do people need more than 3 hours of 1 second data? I have the gen 2 (only CTs on mains) and it is adequate for my needs. I just open the app up when I am testing something. All I need is to see what is going on at that particular moment.
The Eyedro in my house is like that, it only uses mains current flow. I actually prefer it over the Emporia in the shop.

After you observe various loads, you can pretty well discern which loads are on. If I don't know, I ask my wife what she is doing at the moment. :ROFLMAO:

Eyedro will give peak demand and calculate usage over long periods. I use it to know how much PV was generated and used on our system as we run the house off grid. Great graphing and historical data. One can zoom in any time. Emporia is severely lacking in application.

I just checked out consumption on the Eyedro since we flipped the switch and I have back 10% of my system cost since then. Max demand was 6.7Kw at 11:54 AM, (wife came home to make lunch- microwave and I'm sure she flipped on plenty of loads). I can zoom in on graphs to 1 second interval.
 
Do you really 86,400 samples in a day for each channel, or do you want average numbers (how many KWHR that device uses) and peak power (aka surge) so you can size your inverter?
I'm using an Acrel RS485 box that I poll several times a second, publish to an MQTT broker, and keep track of peaks. Then I update Redis from the MQTT and scrape the latest (and peak) numbers from Redis once a minute to write to SQL.
1721872004647.png
 
Just curious, why do people need more than 3 hours of 1 second data?
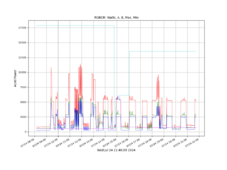
It isn't 3 hours of 1 second data.

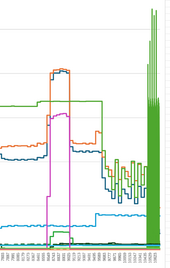
It only records and stores 1 second data if you are ACTIVELY WATCHING IT. Here is an example where I only watched it in the last 4 minutes:

1721875829069.png
The prior data when downloaded has an entry for every second, but you find that 60 consecutive samples are identical. They average a minute and stored that one value 60 times in the "1 second" data file. When you go to look at the data live, then and only then does it stored the 1 second data which you can see at the end of the image above. If you are trying to find the peak power, the 1 minute data sorely misses those, but the 1 second doesn't. You need to know peak power to size an inverter to handle the loads.

In the above, the green trace seems like it has a low peak power in the right most region, but when you look at the actual 1 second data, you see it has huge peaks.

This is why the Emporia system lies. Not even the "1 second" data is actually 1 second. They collapse it down to 1 minute when you aren't looking at it. Sneaky, huh?

Mike C.
 
Quicker reaction speeds and more accuracy for automations currently
1 second data is fine for real time load control automation, that wasn't the issue. The question was why do you need 1 second data post facto?

IOW what real use is 1 second data from last week, or even several hours ago when the need for responsiveness has long passed?

I guess if your storage has the capacity then no big deal but resources are often not unlimited so it makes sense for data to be consolidated to some degree.
 
As I mentioned the way to snag data all the time if it means that much to you is to use home assistant. It accesses the api exactly like your browser would continuously and stores it locally. Then you can use HA's tools to sift thru the data.
 
1 second data is fine for real time load control automation, that wasn't the issue. The question was why do you need 1 second data post facto?

IOW what real use is 1 second data from last week, or even several hours ago when the need for responsiveness has long passed?

I guess if your storage has the capacity then no big deal but resources are often not unlimited so it makes sense for data to be consolidated to some degree.
That I agree I wouldn't find any benefit to saving the data except purely to size my system(accurate peak current) I average 16gb of data per year currently monitoring energy for certain devices/circuits and environment (temps, humidity, pressure, pm levels, lux and rainfall) none of which have below 20s polling but the historical data is fairly interesting as far as climate change. I have a few spare CT clamps and voltage meters that run on modbus so I'll likely see how low I can get polling with them and fit it to my main incoming lines when I have some free time from procrastinating.
Temperature has been rising each year in Thailand which in turn means we run more fans and AC works harder also energy prices have been increasing and fairly rapidly I saw a post that electricity might go up as much as 44% next year here so the faster I can size my system and plan the install the better.
 
1 second data is fine for real time load control automation, that wasn't the issue. The question was why do you need 1 second data post facto?
To find the peak power your system uses so you can size the inverter to handle it.

Peak power is statistical. It will occur when the stove is on, the dryer is on, and the AC is on, and someone runs the microwave, just at the time the well pump starts. This might happen once a month for 10 seconds! Peak power is very transient.

If all you care about is ENERGY you need, then 1 second data is not useful, but systems have to be rated for POWER to meet the demand.

For example, if your house uses an AVERAGE of 1 KW (720 KWH per month), a 1 KW rated inverter WILL NOT WORK, it will be severely overloaded. You might not even be able to run that house with a 20 KW inverter system. You just don't know until you can find a way to characterize your peak power demands which requires fine time resolution data.

Mike C.
 
To find the peak power your system uses so you can size the inverter to handle it.
One does not need to store 1-second data for hours, weeks, months in order to assess that. Only the peak power value and when it occurred.

You can go back to look at say the 10- or 30-second average data to get a sense of the general load around that time, but if all you are assessing is peak, then it's just the peak value you need to capture and save, not the rest of it.

In any case, most such devices are incapable of capturing the true surge demand which is what is needed for specifying inverter capacity.
 
One does not need to store 1-second data for hours, weeks, months in order to assess that. Only the peak power value and when it occurred.
Think I'd prefer to store it for a week live normally and review the data when I have time rather than spend every waking hour watching a screen like a modern day teen.
 
Peak power is statistical.
?

Think I'd prefer to store it for a week live normally and review the data when I have time rather than spend every waking hour watching a screen like a modern day teen.
There is no need for that. All it requires is a max power sensor which stores how much the peak was and when. You can review that stored value at any time later at your leisure.
 
There is no need for that. All it requires is a max power sensor which stores how much the peak was and when. You can review that stored value at any time later at your leisure.
If your talking about HA do you have a template for that? it would be much appreciated.
 
If your talking about HA do you have a template for that? it would be much appreciated.
No since I have no need for it. But I'd imagine a trigger based sensor would do it, something like this example for capturing maximum temperature:
Code:
template:
  - trigger:
      - platform: state
        entity_id: sensor.openweathermap_temperature
        not_to:
          - unavailable
          - unknown
    sensor:
      - name: Highest Temp Ever
        unique_id: c6174f4d-0709-4e70-a675-5ba3f07c80a0
        state: >
          {{ max(trigger.to_state.state | float, this.state | float(-999)) }}

Obviously use you own sensor name/ID and the sensor you are tracking.

As described here:
 
It isn't 3 hours of 1 second data.

It only records and stores 1 second data if you are ACTIVELY WATCHING IT. Here is an example where I only watched it in the last 4 minutes:

If I need one second data, I am actively watching it because I am testing something (i.e. monitoring a device right then and there). What happened earlier (second by second) is irrelevant to me. For me the rest of the data I get from the app is good enough. That is why I asked just what people were doing that they needed that sort of resolution in the past.
 
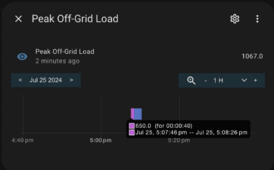
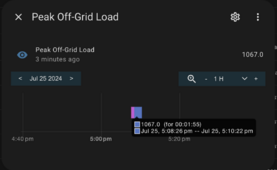
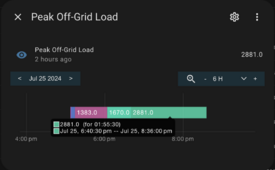
I just created this for fun:

Code:
  - trigger:
      - platform: state
        entity_id: sensor.load_power
        not_to:
          - unavailable
          - unknown
    sensor:
      - name: Peak Off-Grid Load
        unique_id: peakoffgridload01
        state: >
          {{ max(trigger.to_state.state | float, this.state | float(-999)) }}

And it is now a live sensor capturing peak load values from my off-grid inverter:

Screen Shot 2024-07-25 at 5.10.51 pm.png Screen Shot 2024-07-25 at 5.10.59 pm.png
 
I just created this for fun:

Code:
  - trigger:
      - platform: state
        entity_id: sensor.load_power
        not_to:
          - unavailable
          - unknown
    sensor:
      - name: Peak Off-Grid Load
        unique_id: peakoffgridload01
        state: >
          {{ max(trigger.to_state.state | float, this.state | float(-999)) }}

And it is now a live sensor capturing peak load values from my off-grid inverter:

View attachment 231047 View attachment 231048
I'd be using apparent power as this accounts for power factor also I can try dig out the template but I think I did it in the helper ui there should be an built in option for it.
 
It's but an example of capturing a peak value of any sensor you like.

Been running a few hours:

View attachment 231067
What I mean is peak power on typical meters isn't actually peak as it accounts for power factor most of the high current draw items in my home are "high efficiency" so likely have a lower power factor.
When an inverter specs show a peak power rating that's going off a pf of 1.0 when in reality most of today's appliances generally don't run at 1.0 so if I don't measure in apparent power(KVA) I might be wrong when selecting an inverter.

Obviously if you give yourself large margins that's fine but if your going tight say for example your peak power is 8kw so your thinking a 5kw inverter will be fine as it has 10kw peak power if your pf is lower than 0.8 your going to be pushing the inverter more than you should do and possibly might be going into overload.

This likely doesn't apply to you and I might be completely wrong I'll wait for one of the EE guys to verify but to anyone looking to measure their load and spec what inverter to buy if correct it possibly might be valuable information for anyone that's reading.
 
What I mean is peak power on typical meters isn't actually peak as it accounts for power factor most of the high current draw items in my home are "high efficiency" so likely have a lower power factor.
I know all that.

I was just providing an example of how to track when a peak value occurs and what value that peak was. It could be voltage, power, VA, current temperature or whatever value you wish to track. Can use the same method to track minimums as well. I just chose a power sensor by way of example.
 
Just curious, why do people need more than 3 hours of 1 second data?
Personally I don't think the data has much value at a 1s resolution for archival purposes, but there can be isolated channels that you want to analyze in ways other than average. I use Influx to count events in one hour windows from my 5s data as an example, so my hourly windows might show max, min, mean, integral, and motor starts.

Other times you have a problem and need to troubleshoot it. My solar hot water collectors started leaking. I trend the daily minutes the circulator pump runs, and started to see why the hot water wasn't working properly. The circulator pump is on a shared circuit though, so separating out that operation is more complicated than looking at an average load-- I need to count spikes relative to a moving average to get the data.
 

diy solar

diy solar
Back
Top