diy solar

diy solar

SRNE Odd MPPT Charging Behavior - Pause Every 12 Minutes?

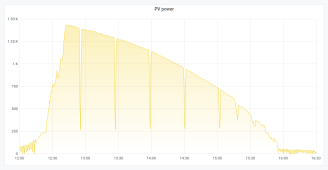
Yes, that is a Solar Assistant graph from yesterday's production of my EASun 8kW. I only have a small 2.2 kW array feeding it at present.

OK, I made a mistake, I thought I was answering @Wakintx who has an AIO SRNE.

Your EAsun is connected with Solar Assistant with the Voltronic or SRNE protocol?
 
Last edited:
After having carefully analyzed what is happening, as SRNE told me by e-mail.
This is indeed a sweep of the MPPT to find the maximum power point.

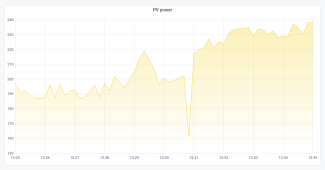
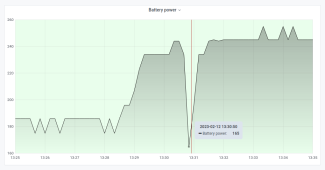
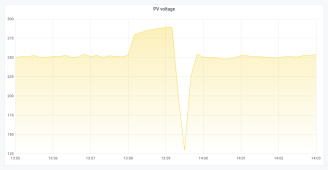
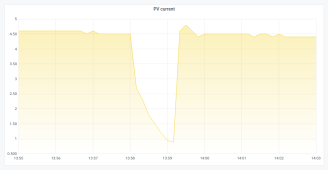
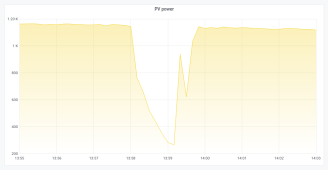
On the graphs below, we can see that this scan starts at 1:29 p.m. and ends at 1:31 p.m.

Before 1:29 p.m. the power is +/- 200W and after 1:31 p.m. the power is +/- 230W, so we can say that the MPPT has found a better point. (no sun today at my place)

In my case it's a 120V to 450V MPPT.

From 1:29 p.m. the SCC starts looking for the Vmp voltage and the voltage rises (but not to Voc which is 290V at that time) then the voltage goes down to 120V which is the low voltage of my MPPT (seen on the screen ) before going up to Vmp.

What I find stupid is that when the MPPT starts scanning towards a higher voltage and it doesn't find better power, it should drop right back down instead of continuing to climb even higher and lose even more power.

Solar Assistant shows that other AIOs don't have this behavior so yes, we can say that the MPPT algorithm is unfortunately not great.

Yet I know that SRNE makes good MPPT SCCs that are widely used around the world. Strange...

That said, I don't want to generalize and it may be related to my model / firmware...
I remain convinced that this can be corrected with a new firmware.
On the other hand, I am less convinced to have soon a new firmware. ?
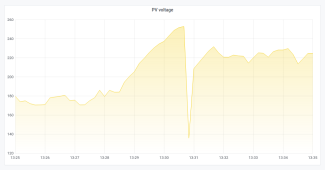
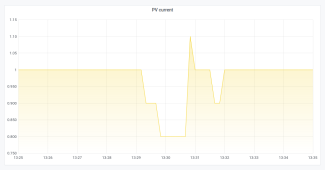
09_PV_Volt - Scan every 30min.png

09_PV_Current - Scan every 30min.png

09_PV_Power - Scan every 30min.png
 
  • Like
Reactions: mib
Interesting post about how an SCC MPPT works.
Mine behaves like point 2) so fulll sweep.


So how do you replace this clever man with an algorithm? There are three basic ways I know of:

1) Simple backoff from OCV. Most panels produce their maximum power at about 80% of their OCV. So a simple way to implement this would be to disconnect the array momentarily, measure the voltage, then reconnect it and make sure the voltage never dropped below 80% of that value. You have to do this periodically to track changes due to temperature, clouds etc. The old RV Power Products (now Blue Sky Engineering) MPPT chargers did this.

2) Full sweeps. If you ramp your PWM from 0% to 100% you will see a point at which maximum power is produced. Then you limit your minimum voltage to that level. You can't do this if your batteries are close to fully charged because they won't accept all the current you need to run that test - but when you are close to full charge you don't need full power anyway.

3) Small sweeps. At startup you make a reasonable guess as to maximum power point (i.e. you measure the input and output voltages, divide and set the PWM value slightly above that) and then go up and down in both directions. If power increases you keep going in that direction; when power starts decreasing again you reverse direction. Since you can do this continually with very little loss in power you don't have to do anything periodically. This system is harder to stabilize than the above two.

You can also do a hybrid of 2 and 3 - do a full sweep on startup then small sweeps afterwards. The old MX60 did this.
 
From your symptoms it seems more like #1 since your icon for PV goes off (disconnect from array).

I think that's a question you should ask whoever programmed this algorithm. The PV icon flashes during this procedure, this does not necessarily mean that the PV system is disconnected, it may mean that a scan is in progress. Only the person who programmed this algorithm knows that.

If the PV system was completely disconnected the PV power would drop to 0W for a moment which is not the case. The PV power goes from 202W to 161W before rising to 217W. For information, the measurement of the current A given by the EAsun for the PV input is false, in reality it is always a little more so at the lowest it can be 175W in reality.

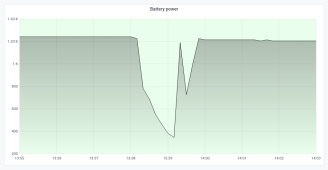
The battery power graph coming from the BMS also shows that the charge decreases but does not stop. So I think it is indeed a full sweep without disconnection as mentioned in point 2.

I won't be at home for the next few days but I could do an additional check on Wednesday with an ammeter clamp and the return of the sun :cool:

1676212051548.png
 
  • Like
Reactions: mib
I think that's a question you should ask whoever programmed this algorithm.

...
LOL. Programmers and why they choose to do something a certain way is beyond me to fathom. Brilliant folks by and large but their thought process is not similar to mine.
 
What's interesting is that @Aerial Gopher who had a SRNE 3Kw 24v system, 120 volt out model. ( HF2430U60-100 ? ) could see this scan every 12 minutes in Solar Assistant. Was the PV icon flashing at this time ?

Edit:

It appears to be the model HF2430U60-100 he purchased in May 2022 see post below.
It would be interesting to know what firmware his AIO had but we probably won't know because he sent it back to buy a Growatt.


And by reading this post we can learn that MidNite sells the 24V-3000W and 48V-5000W 120V AC model for $785 / $1246 maybe with a magic firmware ? :rolleyes:
Reading the MidNite manual will convince you that it's indeed an SRNE.

 
Last edited:
  • Like
Reactions: mib
Trying to make special watch of my EAsun AIO it does have a MPPT cycle where it drops off loading (and the fans cycle down) for a bit and than starts back up max PV output. It does not cause the PV icon to flash off and it also seems to not drop wattage entirely. However if it is on a certain repeating time period I can not say. One issue is the battery charging program can also cause a change in PV demand as it polls the DC bus.

Without a graphing program I can not be definitive.
 
While it's demonstrating something strange, I think assessment of what's going on needs data collection at a much higher frequency than the 6 Hz Solar Assistant is capable of showing.
 
I know that @mib is tempted to connect his SRNE to Home Assistant, maybe we can have a nice graph soon?

The wifi datalogger will not allow this to be seen as it only takes data every 5 minutes.

If you are interested, I could make you a script in Python to analyze the data via modbus by connecting your PC to the USB port of the AIO?
 
  • Like
Reactions: mib
While it's demonstrating something strange, I think assessment of what's going on needs data collection at a much higher frequency than the 6 Hz Solar Assistant is capable of showing.

Solar Assistant collects data every 2sec for the dashboard versus 10sec in the charts.

Via a Python script I could get even more info like every 0.5sec.
 
  • Like
Reactions: mib
I know that @mib is tempted to connect his SRNE to Home Assistant, maybe we can have a nice graph soon?

The wifi datalogger will not allow this to be seen as it only takes data every 5 minutes.

If you are interested, I could make you a script in Python to analyze the data via modbus by connecting your PC to the USB port of the AIO?
:) Thanks for the offer but even though I am a Linux user of a couple of decades (computer user going back to DOS 5.0) now my abilities to understand how all these things operate is limited. I would say I am pretty much computer illiterate beyond simple follow step by step the recipe type of interactions.
 
at a much higher frequency than the 6 Hz Solar Assistant is capable of showing.
Not sure what I was thinking, SA doesn't show at 6 Hz.
At best it's 0.5 Hz (display), while charting is at 0.1 Hz.

Via a Python script I could get even more info like every 0.5sec.
That really only helps if the data stream being captured is updated with a high enough frequency to make that worth while.
 
  • Like
Reactions: mib
I know that @mib is tempted to connect his SRNE to Home Assistant, maybe we can have a nice graph soon?
For now I'm just dreaming :)

maybe it can be seen with current clamps on the pv line?

I have two mppt srne ml2440 there is no such problem, for the reason that I am very satisfied with ml2440 I bought AIO Srne :)
 
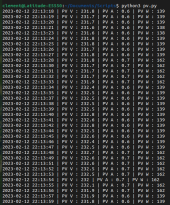
Attached is the script, it works for me from Linux after installing the "minimalmodbus" lib.
Should also work on Windows. In any case, the COM port address (/dev/ttyUSB0) must be adapted to your environment.

I set the time to 1sec, this can be decreased but I think 1sec is good because it needs time for AIO to write to modbus registers.

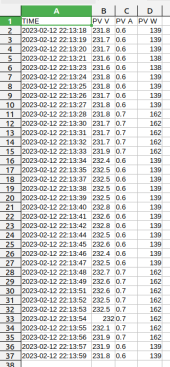
You can see what's happening on screen and also in a CSV file (pv.csv in the same folder as the script) which you can open in Excel or OpenOffice to analyze the data.

CTRL+C to stop the script.


Installation of minimalmodbus on Debian/Ubuntu.
Code:
sudo apt install python3-pip
pip3 install -U minimalmodbus

On Linux, connect your PC to the AIO via the USB port then give access rights to the COM port before running the script.
Code:
sudo chmod 666 /dev/ttyUSB0

Run the script
Python:
python3 pv.py

1676236696556.png

The information collected in the pv.csv file

1676236547547.png

And if you want to read other info, I also attach the SRNE modbus protocol with the list of registers.
 

Attachments

  • srne_pv_stats.zip
    774 bytes · Views: 5
  • SRNE hybrid solar inverter MODBUS protocol V1.7.pdf
    445.9 KB · Views: 10
Trying to make special watch of my EAsun AIO it does have a MPPT cycle where it drops off loading (and the fans cycle down) for a bit and than starts back up max PV output. It does not cause the PV icon to flash off and it also seems to not drop wattage entirely. However if it is on a certain repeating time period I can not say.

This is exactly what is happening, the reduction of the fans until the complete stop then a resumption of maximum power load.
Except that during this phase, my PV icon flashes => it's a firmware improvement :ROFLMAO:

I took a video for you => SRNE MPPT sweep video

Below are the graphs corresponding to the video.

The next time I measure the current on the PV input, if there is a total disconnection when the voltage rises near Voc then the current from the PV must be 0A and not 0.9A.

1676326708126.png

1676325056414.png

1676325076030.png

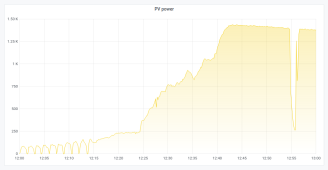
It's still a loss of production of 2 minutes, I find it ugly!

16763251207955


Data from the BMS :

Here too the BMS still registers a load of 346W at the lowest point. If there is a total disconnection, this charge may come from the capacitors ?
 _
 
Last edited:
  • Like
Reactions: mib
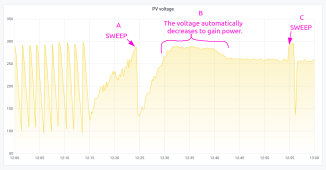
Between the two sweeping phases A and C, we can see that the MPPT is able to automatically adapt the voltage by decreasing it to get more power. Why make such a brutal sweep every 30 minutes ?

10_PV_Volt - Scan every 30min.png

1676327992320.png

1676328052991.png
 
  • Like
Reactions: mib
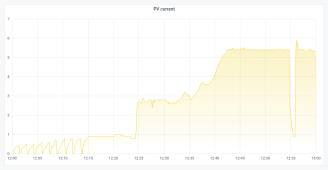
Measurement with the current clamp. The current coming from the PV is at 5.55A before the "sweep" begins, it suddenly drops to 3.69A then gradually decreases to 1.34A (0.8A on the EAsun screen) while the voltage rises towards Voc then the current rises suddenly towards +/- 3.5A while the voltage falls then rises towards Vmp.

=> Video of the measurement with the current clamp
 
  • Like
Reactions: mib
Back
Top