I recently received a YR1035+ meter and I wanted to see just how good it is. I have a Hioki LCR meter that was recently calibrated to compare to. One of the things I did was to see if the YR could measure the ESR of an electrolytic capacitor. First I measured the capacitor on the Hioki and this is what I got:

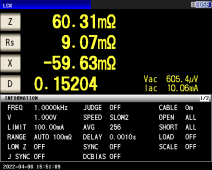
In another post I've seen it suggested that because the YR uses AC to make its measurement it may be measuring impedance rather than resistance. Hedges explained in another post what impedance is. The usual expression is Z = R + jX, so impedance has two parts, the resistance part R and the reactance part X. In the image above the Hioki meter is able to separate those two parts--Rs is the resistance part and X is the reactance part. Impedance magnitude is a vector combination of the two parts, and the magnitude of that combination is denoted |Z|; the Hioki only shows Z in the image above, but it's really displaying |Z|. You can see that the impedance magnitude is about 60 milliohms although the resistance part Rs is only 9.07 milliohms. If the YR were in fact measuring the impedance magnitude that would be a gross error when we really want to measure the resistance.
So, I'm happy to report that when I measured that capacitor with the YR, I got a reading of 8.1 milliohms--it is not fooled by that fact that the capacitor has a reactance part of -59.63 (minus sign because it's capacitive reactance) milliohms. That large reactance part is causing a few percent error, but this is an extreme case. A typical battery impedance won't have a reactive part that is more than 5 times as large as the resistance part! This all means that the YR is able to reject the effect of a reactive part and measure only the resistance, not the impedance magnitude.
I also compared the YR's performance when measuring a length of hookup wire. The Hioki read 5.6 milliohms, and the YR read 5.52 milliohms. I can't complain much about that.
Attachments
Last edited: