Here's a chart showing temperature effects of a cell.
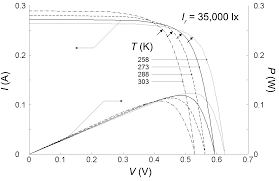
Temperature is shown in K (kelvin) going from 258 K (-15 C) to 303 K (30 C). The darker line represents 273 K (0 deg.C). The first thing to notice is the hotter the cell the greater Isc.
At -15C, Vmp is about 0.54V
At 30C, Vmp is about 0.42V.
That's about 29% decrease in Vmp over 45C. That computes to -0.64%/C. That is quite a bit higher than -0.41%/C which I used for my previous calculations. Current temperature drift was not factored into the -0.41%/C value.
")