Over the years I have heard many stories from people complaining about their smart meters. everything from my bill went way up, my data is wrong, and the radio waves will kill you.
After seeing this data, I have to wonder about how these meters can come up with some of this data
On Oct 5 at 2am, lightning burned an outbuilding on my property to the ground. The electric meter was attached to the building and was also totally destroyed. Oncor came an hour later, about 3am and disconnected power at the street. We had no grid power for about 34 days and relied on our off grid solar system.
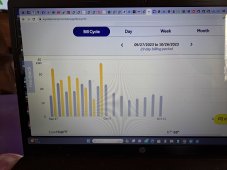
In looking at my electric bill, I am seeing usage from Oct 5 thru oct 10, which is impossible.
the yellow bars are what my gridtie sent out to the grid, of course it correctly stops after Oct 4
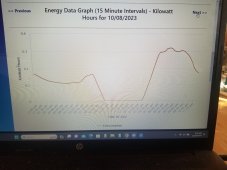
I also see the hourly data for each of these 5 bogus days are almost identical in pattern.
I was billed for this bogus usage.
this is from reliant showing an average of about 15 kwh per day between oct 5-10

here is a sample day from smart meter texas showing the per hour usage on one of the days in question. All 5 days have a very similar pattern

Not sure I have the time or patience to call and try to get an answer on why this bogus data exists,
After seeing this data, I have to wonder about how these meters can come up with some of this data
On Oct 5 at 2am, lightning burned an outbuilding on my property to the ground. The electric meter was attached to the building and was also totally destroyed. Oncor came an hour later, about 3am and disconnected power at the street. We had no grid power for about 34 days and relied on our off grid solar system.
In looking at my electric bill, I am seeing usage from Oct 5 thru oct 10, which is impossible.
the yellow bars are what my gridtie sent out to the grid, of course it correctly stops after Oct 4
I also see the hourly data for each of these 5 bogus days are almost identical in pattern.
I was billed for this bogus usage.
this is from reliant showing an average of about 15 kwh per day between oct 5-10

here is a sample day from smart meter texas showing the per hour usage on one of the days in question. All 5 days have a very similar pattern

Not sure I have the time or patience to call and try to get an answer on why this bogus data exists,


