diy solar

diy solar

RCinFLA - any thoughts on this?

sunshine_eggo

Happy Breffast!
Joined
Oct 26, 2021
Messages
15,943
Location
HBR, USA (6500' in ENE AZ)
@RCinFLA

Hopefully, you can explain something.

I've recently tested 73 older CALB 40Ah cells for capacity, internal resistance and self-discharge.

History:
Probably 10+ years old.
Part of a 10kWh aftermarket 04-09 Prius Plug in Hybrid pack operating in Phoenix AZ, unknown mileage.
When car was sold, pack was removed, balance boards on each cell drained cells to 0.6V for weeks/months.
5 cells (don't remember which) were loose and were NOT discharged - resting around 3.3V.
Gentle charges until >3.0V then individual 20A charge/discharge to measure capacity... all north of 20Ah.
Stored fully charged for about 3 years.
Aforementioned testing of 73 cells.
Sit for a few weeks.

On a whim, I decided to cycle a cell with sense leads attached as all prior testing was intended for comparative purposes. This particular cell tested 19.6Ah on the prior test using voltage as sensed by the test leads rather than sense leads.

This cell tested 1.5mΩ on a YR1030 vs. 0.8mΩ datasheet.

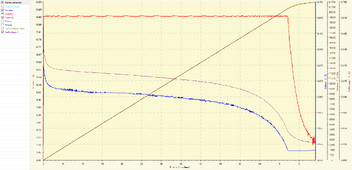
The following three curves are three consecutive discharges (20A to 2.5V, taper current to 1A, terminate) of voltage vs. time, with Ah noted:
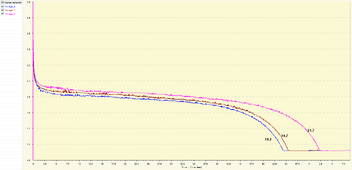
1704941878525.png


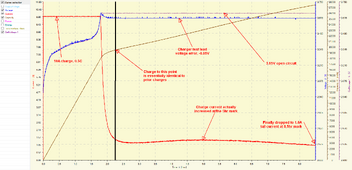
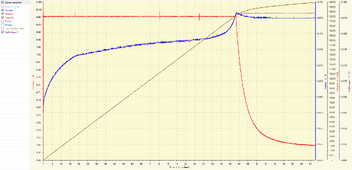
This was a 10A charge to 3.65V with a tail current of 1A (approximately 0.05C), 19.7Ah input, curves as expected:
1704942006307.png

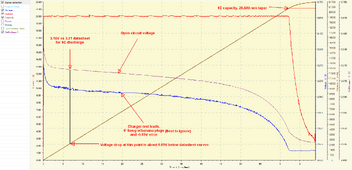
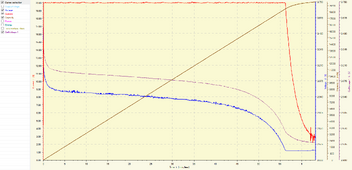
This generated the following 19.7Ah discharge (20A to 2.5, hold and taper current to 1A), curves as expected:
1704942073223.png

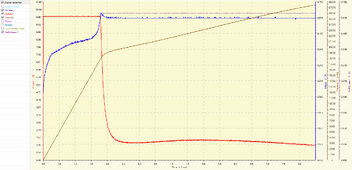
Here's where it gets weird... the next charge, 27.5Ah input, WTF???:
1704942120877.png
What's really noteworthy is the crazy extended "absorption" period.

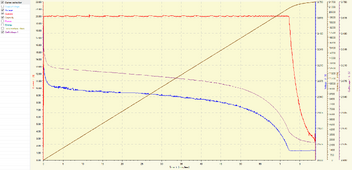
Following discharge, 21.7Ah, curves as expected.:
1704942210006.png

Subsequent charge, 21.8Ah, curves as expected.:
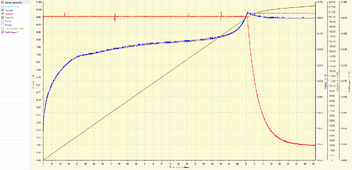
1704942644559.png

final discharge, 21.7Ah:
1704943779469.png

Summary:

CHG1/DCH1: top off/19.2 (3.65V charge terminated at 2A, not 1A tail)
CHG2/DCH2: 19.7/19.7 (3.65V, 0.05C)
CHG3/DCH3: 27.5/21.7 (3.65V, 0.05C, WTF?)
CHG4/DCH4: 21.7/21.7 (3.65V, 0.05C)

All discharges were 20A to 2.5VOC, taper to 1A, terminate initiated 1 minute after termination of charge.

Note that the charger logic starts tapering at TEST lead voltage of 2.50V and 2.66VOC and tapers current as it approaches 2.5VOC.

WTF happened? How did the cell accept an additional 6Ah of input in such an odd way, and how did capacity bump up by 10% with cycling after this odd charge? I use this charger on a very regular basis, and confirmed it's reasonably accurate with a fluke voltmeter and a CL800 clamp DC ammeter, so I don't believe this is related to a hardware issue.
 
Sub’d cuz I actually know nothing about this stuff and maybe I will
 
The voltage slump during top-off tail charge is not normal. It is caused by high overpotential voltage vs cell current and possibly high cell leakage rate due to lithium metal shorts. You can check for leakage by just checking how much voltage drop cells get after a few weeks of open circuit storage.

You have a large overpotential voltage slump for 0.5 C(A) rate discharge. Overpotential voltage slump vs cell current is a much better indicator of cell health then 1 kHz cell impedance test.

The electrolyte is degraded and probably more cell impedance due to excessive SEI thickness growth.

In non-tech terms, the cells are worn out.

End of life for lithium-ion battery is when the overpotential voltage slump at required discharge current causes too much net battery voltage drop under required maximum load current.

'Second life' used cells just means the cells are considered useable for a lower peak current application and no long support high current loads like for EV use. The maximum current a used cell can support is defined as the load current level when the overpotential voltage slump exceeds about 0.25-0.45 vdc. Cell overpotential has an exponential time decay and takes 1-3 minutes to reach equilibrium steady state after load applied.

Round trip energy input vs energy output efficiency degrades as cells age and there is greater internal cell heating.

Every time a cell is cycled there is expansion and contraction of graphite negative anode electrode (max about 11% graphite volume for full SoC range). This puts stress cracks in the Solid Electrolytic Interface (SEI) coating around graphite which protects electrolyte from electrons escaping graphite during charging. SEI cracks are regrown and repaired on subsequent recharging but the regrowth consumes some free lithium and electrolyte reducing cell capacity.

This is normal, inevitable wear mode on lithium-ion batteries. SEI repairs also continuously thicken the protective shell which increases cell impedance slightly.

LFP batteries have very strong positive cathodes due to iron providing cathode structure support when fully charged, so negative graphite electrode is the weak link.

On other types of lithium-ion batteries, like NCA, NMC, the cathode is the weak link and wears out first due to fracturing of positive electrode when fully charged. These types of positive electrodes become structurally weak when cell is fully charged and is why it is recommended not to fully charge them to maximize cell life.

NCA cathodes have a full cycle life count about an order of magnitude less than graphite anodes. (few hundred vs few thousand full cycles)

Downside of LFP is lower cell voltage which reduces their energy density.
 
Last edited:
The voltage slump during top-off tail charge is not normal. It is caused by high overpotential voltage vs cell current and possibly high cell leakage rate due to lithium metal shorts. You can check for leakage by just checking how much voltage drop cells get after a few weeks of open circuit storage.

That's an issue with the charger. The purple line is the OCV and stays constant at 3.65V as current tapers. The blue line is the test leads as influenced by current. The sense leads are accurate. The test leads read 0.05V low. Essentially, the blue line should be ignored.

For this specific cell, it read 3.31 after sitting for a couple weeks. I didn't record the OCV, but after storage for nearly 2 years, it only needed 1.5Ah (5.2%) of input to top it off prior to the bulk testing of the 73 cells a few weeks ago.

You have a large overpotential voltage slump for 0.5 C(A) rate discharge. Overpotential voltage slump vs cell current is a much better indicator of cell health then 1 kHz cell impedance test.

Given the actual capacity of these cells, this is much closer to a 1C discharge. I do agree that the overpotential is excessive as the voltage curve is about 0.05V below what the datasheet curves read, and it seems to be proportional to the increase in impedance.

The electrolyte is degraded and probably more cell impedance due to excessive SEI thickness growth.

In non-tech terms, the cells are worn out.

End of life for lithium-ion battery is when the overpotential voltage slump at required discharge current causes too much net battery voltage drop under required maximum load current.

'Second life' used cells just means the cells are considered useable for a lower peak current application and no long support high current loads like for EV use. The maximum current a used cell can support is defined as the load current level when the overpotential voltage slump exceeds about 0.25-0.45 vdc. Cell overpotential has an exponential time decay and takes 1-3 minutes to reach equilibrium steady state after load applied.

I'm not questioning any of the above. When I procured these cells, I had very little expectation that they would meet anything near rated, and the planned application will be under 0.2C per cell.

Round trip energy input vs energy output efficiency degrades as cells age and there is greater internal cell heating.

Understood. High voltage rise during charge means more power input. High voltage drop during discharge means less power output - an ever-widening trend. Third cycle was 73.5Wh in (0.5C) and 62.5Wh out (1.0C).

What I was most confused by was the CHG3/DCH3 and hoped you could provide some insight.

What caused the current to rise once 3.65V was attained? Temperatures were not monitored, but temperature was never more than slightly warm to touch in 75°F ambient
What happened to the extra 6Ah input that was not output?
How did the capacity "jump" up 10% after this odd charge?
Odd charge:
1704982844520.png

After this odd charge cycle, normal charges/discharges occurred, but went from mid-19Ah to a consistent 21.7Ah.

1704983937137.png

FWIW, I conducted a 4th cycle while composing the post, and the cycle was "normal" - consistent with the 21.7 in and 21.7 out.
 
I think what you've come across could be memory effect. Check: https://nordkyndesign.com/practical-characteristics-of-lithium-iron-phosphate-battery-cells/ and search "memory effects". This is just a guess, I've not read your post in detail...

"memory effect" (source paper as that article takes some editorial/paraphrasing liberties, different article by one of the study authors) manifests as a shift in the voltage to SoC relationship, not an actual capacity loss. All charges were to 3.65V with a 0.05-0.1C tail current. All discharges were to 2.5V starting at 1C and ending at 0.1C.

I could see a slight gain, but 10% seems off.

I can't find the reference, but there was a study that lithium plating could be partially reversed by applying a brief high current discharge immediately after a full charge. Wait times between cycles were only 1 minute, so maybe it liberated some lithium ions? But that's not consistent with the obvious overcharge in the odd charge cycle - that would seem to encourage plating and capacity loss.

Batteries are magic.
 
Back
Top