diy solar

diy solar

Grafana Dashboards

parody

New Member
Joined
Oct 28, 2022
Messages
86
My Christmas holiday project... Taking inspiration from some existing repos using pysolarmanv5, I've made a good number of changes, additions, fixes, improvements etc to suit my set up, which includes the ability to poll multiple inverters using different modbus mappings, and in addition from the Bright smart meter API. Also added some automation to enable and disable our hybrid car charger on a smart socket when there is excess solar during the day. The data is polled every 20s, running in a docker container on my local unraid box, writing to InfluxDB.

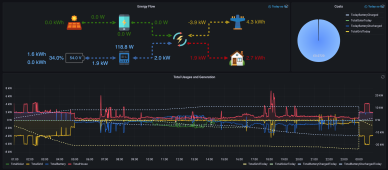
The most fun part is the dashboards - this is my favourite one which is displayed on a wall mounted tablet alongside some other smart home stuff. I think I've improved on the solis cloud/solarman accuracy and detail by quite some margin. The Flow shows inverter losses, day totals and current values, battery SOC, voltage and charge/discharge totals (screen grab taken at night so no solar production). The time series shows all that over the day. Costs I'm still working on, but is mostly accurate except for early morning when the night rate make it go a little wonky:
1673485006595.png

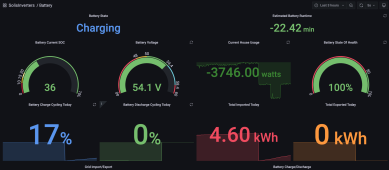
I've done some other detail dashboards for battery stats, ad-hoc queries, solar breakdowns etc but they are less pretty. I do like the battery runtime estimate though which is quite accurate when in discharge state, I will add that to the Flow above:
1673485324026.png
 
Last edited:
Very cool. I still can't get my Grafana to connect to Influx and haven't had the time to do a deep-dive on it yet.

[Edit] You inspired me; got the connection working and now it is time to play.
 
Last edited:
Wow, I'd love to have the energy flow diagram on my Grafana. Can you share the secret sauce there?
 
Wow, I'd love to have the energy flow diagram on my Grafana. Can you share the secret sauce there?
I think I will make the whole thing public at some point. What do you already have - what is your data source? The flow is using the FlowChart plugin (https://grafana.com/grafana/plugins/agenty-flowcharting-panel/). I got the icons from svgrepo. I could share the json but it would need a lot of remapping to your data source assuming it's different.

I've made a few more updates, pulling in billing and meter reads from the Bright/Glowmarkt API (I have the local device for real time reads too). So have added current and day-so-far reads for comparison to inverter data, and gas usage, and billing based on my time of use tariff. Getting a bit dense now, so the rest of the billing data is on another dashboard.
1673920633082.png
 
The flow is using the FlowChart plugin (https://grafana.com/grafana/plugins/agenty-flowcharting-panel/). I got the icons from svgrepo. I could share the json but it would need a lot of remapping to your data source assuming it's different.
Very slick! Are the arrows static or dynamic based on flow? Put me down as another that would love to see your source; even if it isn't something to use directly it helps in learning.
 
Very slick! Are the arrows static or dynamic based on flow? Put me down as another that would love to see your source; even if it isn't something to use directly it helps in learning.
The arrows are animated (the dotted lines move). I've not yet made them direction based on flow - it is on the list (thats why some have double ended arrows for now). You can modify the arrow heads so direction in that respect should be possible (hide one end for example). The direction of the dotted lines might be harder. You could rotate if it was perfectly symmetrical. Or alternatively flash the line instead of animate.
 
I think I will make the whole thing public at some point. What do you already have - what is your data source? The flow is using the FlowChart plugin (https://grafana.com/grafana/plugins/agenty-flowcharting-panel/). I got the icons from svgrepo. I could share the json but it would need a lot of remapping to your data source assuming it's different.
I wasn't even aware this was possible. So cool.
I'll look into the documentation and the googles later to see if I can figure out implementation. Any hints or pointers would be appreciated.
If and when your willing to share the json, I could import it and edit as needed.

My equipment is Schneider, Midnight, Batrium, and Solar Edge. Probably not much crossover, I don't see as much traffic in this stuff when compared to Growatt and EG4.

What does the lightning bolt in the middle represent?
 
My Christmas holiday project... Taking inspiration from some existing repos using pysolarmanv5, I've made a good number of changes, additions, fixes, improvements etc to suit my set up, which includes the ability to poll multiple inverters using different modbus mappings, and in addition from the Bright smart meter API. Also added some automation to enable and disable our hybrid car charger on a smart socket when there is excess solar during the day. The data is polled every 20s, running in a docker container on my local unraid box, writing to InfluxDB.

The most fun part is the dashboards - this is my favourite one which is displayed on a wall mounted tablet alongside some other smart home stuff. I think I've improved on the solis cloud/solarman accuracy and detail by quite some margin. The Flow shows inverter losses, day totals and current values, battery SOC, voltage and charge/discharge totals (screen grab taken at night so no solar production). The time series shows all that over the day. Costs I'm still working on, but is mostly accurate except for early morning when the night rate make it go a little wonky:
View attachment 129157

I've done some other detail dashboards for battery stats, ad-hoc queries, solar breakdowns etc but they are less pretty. I do like the battery runtime estimate though which is quite accurate when in discharge state, I will add that to the Flow above:
View attachment 129159
Great information and flow…
 
What does the lightning bolt in the middle represent?
That is just something to represent the network of wiring, your fuse board, or whatever - a focal point for your ins and outs. If you mean what do the numbers represent on the last screenshot - that is where I chose to put my meter API readings.

I did struggle with how to count input and output. Are you "pulling" from the grid (-) or... importing feels like a +. But then that would make the equivalent battery discharge a + and that really feels like it should be a -. But then solar needs to be a - and it feels more like a +... and so the circle continues. In the end I decided anything giving my lightning bolt energy should be a - (my bolt is taking energy) and anything consuming from my bolt is a + (so battery charge, house load and grid export become the only +). Interestingly my inverters all do something a bit different with + and - too.

Obviously you can do what you like :)

I'll grab the json later and post it
 
I did struggle with how to count input and output. Are you "pulling" from the grid (-) or... importing feels like a +. But then that would make the equivalent battery discharge a + and that really feels like it should be a -. But then solar needs to be a - and it feels more like a +... and so the circle continues. In the end I decided anything giving my lightning bolt energy should be a - (my bolt is taking energy) and anything consuming from my bolt is a + (so battery charge, house load and grid export become the only +). Interestingly my inverters all do something a bit different with + and - too.
FWIW, convention is power that is generated on-site is negative and off-site is positive; loads are negative. Power exported to the grid is negative, battery charging is positive and discharge is negative. But, as you say it doesn't always work well so use what you like!
 
But, as you say it doesn't always work well so use what you like!
Right... if you then try to use all those in calcs, you have to start reversing signs. So I kept it aligned in that sense. You could flip them all of course, as an alternative, and still have calcs work without issue.
 
I am soon going to be getting a sunsynk/deye/turbo/sol-ark inverter (I believe they are all the same) so will be figuring out the modbus mapping for that too. Then I will have working 3 different Solis inverters with and without modbus decoding, and the turbo... and for the UK, the smart meter API scrape too. I think it will be the most complete single example out there if others wanted to achieve similar, even though it might need edits for their own set up (likely not as complex as my own).
 
Back
Top