diy solar

diy solar

18 month DIY project finally done: 39kW inverter power off grid system

2nd YEAHHHH... today I've just got the final approval from the local electrical energy provider :) :cool:(y)

At 11am I've flipped the manual transfer switch to "Solar Generator" position and I hope I never need to flip it back (I'm an optimist ;)).

Over the next couple of days I will post some updates and charts about how the system works.
 
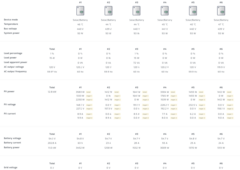
Here is a screenshot of the situation of this morning without load (I've switched the load on, after inspection was approved) while just charging the batteries from solar just before they were full (54.7V).


SolarChargingNoLoad.png

Without load (and without AC-in connected, as usual) I was able to measure the MPPT battery charging efficiency of the whole system and have the following values (via SolarAssistant):
  • 75% (5kW PV production, 3.82kW charging)
  • 84% at 10kW PV production, 8.42kW charging)
  • 86% at 13.7kW PV production, 11.9kW charging)
If I would subtract the AIO's idle consumption (6 * 93W) to find just the efficiency of the MPPT battery charging, the percentages would add up (but I don't know if this is a realistic scenario to just subtract the idle of the AIO's to find the net efficiency of the MPPT together with the battery charger):
  • 86%
  • 90%
  • 91%
I found nothing in the EG4-6500EX manual about MPPT and battery charging efficiency - only the inverter efficiency is listed with max 91%
 
Nope a Navy Nuke is a person in the Nuclear propulsion field... they are known, well known for nuking problems (working everything out t the last detail). they are very, very detail oriented, but ask @Mattb4 if his testicles glow in the dark like Rudolph the red nosed raindeer??? also ask him for the rate of mutation on his kids... any got three eyeballs :p
sorry matt, told you I got tons of jokes for you... Y


ou have not seen the likes of the crayola fueled organically grown fuckery that makes up the USMC. :ROFLMAO::ROFLMAO::ROFLMAO:
Them there is fighting words there sonny. :ROFLMAO:

There two kinds of people in the military, those who are Marines and those who wish there were Marines. :cool:
 
One interesting observation so far.

Today I've noticed some of this usual small LED light "blips" which happens when large loads kicking in or switching off when running with HF off-grid inverters (not the LED pulsing problem with 5-7Hz permanent LED flickering). This is totally ok for an HF off-grid system, in my opinion and doesn't really bother. But today I've noticed such a "blip" every 15-20s for a couple of minutes and SolarAssistant just showing a more or less constant 3.0kW to 3.5kW load over this time.
1714184022746.png

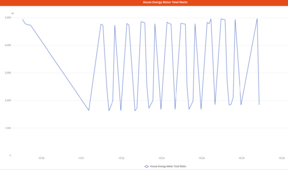
I found out that's the electrical cooktop (an GE-30 glass flat surface, 2019) is the reason. The heating algorithm is like a PWM. The time sensitivity of SolarAssistant is not short enough to catch these short load variations. But my smart home system with the already existing whole house energy meter has the resolution to show this.

1714183650753.png

In 240 seconds it switches the 3.5 kW load load 12 times on and off.

Just an interesting observation and the explanation about this LED "blips" every 20s while the electrical cooktop is used.
 
Last edited:
Thanks for sharing, obviously a ton of thought and attention to detail in your build.

Some have guessed at your background/tech experience, i’d love to know what background resulted in this system.
 
Thanks for sharing, obviously a ton of thought and attention to detail in your build.

Some have guessed at your background/tech experience, i’d love to know what background resulted in this system.
Thanks!

Long ago in 1992 I've got my diploma at an university of applied sciences in electrical engineering in Germany. But I've never worked as an electrical engineer, instead I've started my working life as an hardware-related software developer (protocols, drivers, etc.) and still doing this. BUT electronic is still my passionate hobby.
 
I am very sensitive to noticing changes in the lights, it's an OCD thing so in my new house I made sure the lighting circuits were totally separate from everything else and have the ability to move them into a different panel and inverter if I deem it necessary.
Obviously most people cannot do this but if you are super sensitive to flickery lights, you might want to figure out if it's possible in your home to split the lighting circuits out from everything else.
 
Here are a few more comments about the short LED dropouts if a huge load kicks in or switched off (only on some of the LED's the effect is visible at all).

Before I installed the solar system and used the typical grid supply (200A operation), I noticed slight LED dropouts.
  1. When the 5 ton heatpump turned on (it had 162A inrush before I've installed the soft start)
  2. While my 3D printer is working (mainly when the bed and/or nozzle heated up)
When I try to quantify the effect to notice the LED dropouts visually (which is not easy) and assume a scale from 0-9 (0=LED dropouts not visible, 9=LED dropouts easily noticed) I would give
  1. the heatpump a 8 on the scale when switching on and a 2 when switching off
  2. and the 3D printer a 5 on the scale
After I've installed the soft start for the heatpump (which reduced the inrush from 162A to 33A), it was maybe a 1 or 2 on the scale while still running on the grid when it turned on.

Now with the off-grid inverters running and the softstart installed, I would say that starting the heatpump will again have a 9 when turning on and about a 5 or 6 when it turns off on the scale.

It's all very subjective but my feeling is, compared to the situation with grid
  • when the heat pump with soft start turned on/off the visible noticeable effects are a bit more
  • the 3D printing effects are a bit more
  • the cooktop/wall oven was not visible while on grid, but now it's visible (would give a 4 on the scale)

Overall It's not really bad and I can easily live with this in my situation because only some of the LED's are affected and it happens not often. The most noticeable thing is the cooktop because it's turning on/off relatively often in short timeframes (compared to the heatpump).
 
After 3 days of operation I will tell you about the first impressions and share some initial diagrams.
  • The average consumption load per day was around 55 kWh at this time of the year
  • Solar production was around 72kWh per day
  • The max. seen peak power load at a time was 12.9kW over the last 3 days
  • After each night the remaining SOC is between 55-65% before new solar production starts
  • Usually the batteries are recharged to 100% between 10:30am and 11:00am
  • The charging/discharging distribution between the 6 AIO's and the batteries are very close
  • The load sharing between the 6 AIO's is working very well
  • The AC-output voltage is always very close to 120V with few fluctuations
  • All batteries are very close about their cell delta and the charging/discharging is evenly distributed between all batteries
  • The max. MPPT power of all 8 strings was 17.4kW for a short moment (maybe a cloud edge effect? not visible in the following diagrams because it was too short to be visible over a 3 day range)
  • The active AIO cooling works perfect. The AIO's are usually always below 50°C even under full MPPT battery charging load (which makes the most stress to the AIO's). Even with minimal cooling settings of the ducted mini split, the cooling is enough and it consumes only about 250-300W additional power.
  • The batteries are staying nice cold (they receive a little bit of the cold air from the inverter cooling also)
  • Still no LED pulsing problem (4-7Hz pulsing problem) - for sure some small LED "blips" when huge loads kicking in, as expected
  • AIO's working flawless so far, no dropouts, no faults/errors/warnings

If this situation continues, I will be more than happy with the result (sorry about these many diagrams):

1714402443000.png


1714402467858.png

1714402486445.png

1714402541837.png


1714402573714.png


1714402875111.png

1714402896421.png

1714402929558.png


1714402954359.png

1714402688353.png


1714402709338.png


1714402738674.png


It's really very interesting for me staring at the diagrams and try to get a deeper understanding about the dynamic of the whole system and learning about it.

Update:
The diagrams showing me that (some of them I've expected, some are explainable, some are interesting to notice)
  • If the requested solar power drops (after batteries are fully charged), the MPPT voltage rises
  • In very short situations, the MPPT current was over the max. specified Imppt value (cloud edge effect? - but I have very few clouds)
  • The BUS voltage has a delta of nearly 100V depending on the current situation (between 370V and 470V)
  • The AIO's have the highest losses (highest temperature) when charging the batteries - the inverter seems to be more efficient compared to the chargers
  • The MPPT controlling follows fast with sudden load changes
  • Nice to see how the different orientations of the PV panels to all 4 directions complement each other over the daily production
  • ...
 
Last edited:
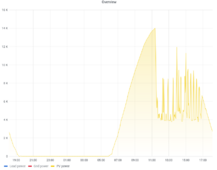
I've done a bit math of the today's power parabola and found the following formula for the PV power:

f(x)≈−0.386082x^2+9.6551x−46.0318

Where x is the current time in 24h system. The diagrams zero crossings are at about 6.25 (which is 6:15 in the morning) and 19.25 (which is 19:15 in the evening). The max. will be at 12:30 with a power of 14.33kW.
If I take the integral from 6:15 to 19:15 I will get a potentially daily energy production of 115.3kWh.

If I take the panels spec I would calculate a max. NMOT power of 13.6kW and a max. SCT power of 19.4kW. So my values are between these two, which sounds realistic for me.

1714439441701.png
 
Last edited:
Absolutely outstanding attention to detail on this one, well done. Looking forward to the continued data output.
 
Short update after the first 5 full running days of the system.

  • No issues not even small ones - knock on wood :cool:
  • Still no LED pulsing!
  • Outside temperatures increased over the last days but still >50% SOC remaining before new solar production starts
  • Done some fine tuning for temperature control of the equipment cooling mini split in the smart home rules. In most cases, it's enough cooling if the target setpoint of the mini split is set just 1°C below the current indoor temperature - this reduces the required power for the mini spit. Only if AIO's temperatures will be more than 54°C the mini split will be ramped up to max. cooling.
  • The max. load power in the last 5 days was 14.8kW for about 2 minutes (short spike not visible in the chart)
  • The max. PV production peak in the last 5 days was 14.6kW at 12:10pm
  • The average PV production per day is about 80kWh (max. 92.1kWh and min. 72.4kWh)
  • The average load consumption per day is about 57kWh (max. 63.5kWh and min. 48.7kWh)
  • The average battery charged per day is about 27.7kWh (max. 32.4kWh and min. 22.2kWh)
  • The average battery discharged per day is about 27.7kWh (max. 31.7kWh and min. 22.2kWh)

1714662744105.png
1714662763407.png
1714662779725.png

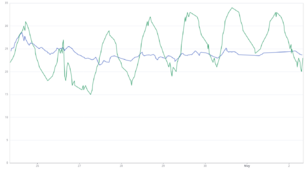
Some temperature charts.
Green is the outside temperature and blue is the RV garage ambient temperature in Celsius (conditioned by a separate mini split with a typical indoor wall mount unit set to 27°C so far - this will be changed by smart home rules in future to manage the load better):
1714662855358.png
1714662883380.png

I feel more and more like the original plan is working... I'll find out.
 
Last edited:
Back
Top