OffgridSystems
New Member
Has anybody seen studies of what the curve of internal cell resistance looks like over the life of a Lithium Ion and Lithium Iron Phosphate (LFP) cell?
According to most papers I'm reading, the end of life comes at 80% of initial capacity value, or internal resistance of 200% of initial value. Also AC impedance can be loosely inferred from DC resistance, that is when one is higher, it's highly likely the other is also.
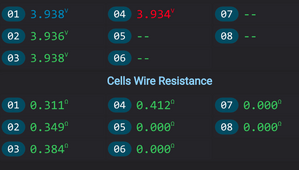
JK and some of the other BMS makers include the feature of measuring DC resistance (DCR) of the voltage sense wires. If the DCR is plotted over time, will that help to predict a loose approximation of lifespan for Lithium Ion?, Lithium Iron Phosphate?
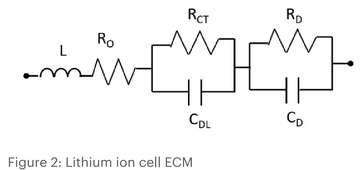
It is understood that the model for a lithium cell is complex and has many components, inductive, capacitive and resistive, thanks to Keysight Technology:

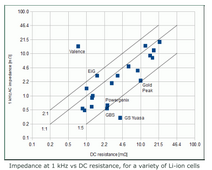
Here's a plot of lithium cells vs their ac and DC resistance taken from Davide Andrea of Elithium:

So, whatdayathink? Is there a way to get a simple, maybe not super-accurate, but thumbnail view of battery life, already built-in to our BMS boards?
Tim
According to most papers I'm reading, the end of life comes at 80% of initial capacity value, or internal resistance of 200% of initial value. Also AC impedance can be loosely inferred from DC resistance, that is when one is higher, it's highly likely the other is also.
JK and some of the other BMS makers include the feature of measuring DC resistance (DCR) of the voltage sense wires. If the DCR is plotted over time, will that help to predict a loose approximation of lifespan for Lithium Ion?, Lithium Iron Phosphate?
It is understood that the model for a lithium cell is complex and has many components, inductive, capacitive and resistive, thanks to Keysight Technology:

Here's a plot of lithium cells vs their ac and DC resistance taken from Davide Andrea of Elithium:

So, whatdayathink? Is there a way to get a simple, maybe not super-accurate, but thumbnail view of battery life, already built-in to our BMS boards?
Tim


