diy solar

diy solar

Off-grid Solar / Battery monitoring and control freeware

Any reference to joe can be substituted with solar, that's a typo i just fixed.

Don't worry about auto starting right now, just focus on getting it working.

Does the script RenogyWanderer.py work from the command line and return a value?
 
I don’t know how to manually run it.. ./run .sh? But not sure how to “git” your code I’m lost on that part I honestly feel like an idiot as I’m sure it’s very simple
 
Assuming python is installed correctly on your system, your simply type at the command line as root

./RenogyWanderer.py

As you would any other script or binary file.
 
@BarkingSpider i dont think i have your code installed(dont recall installing it from steps) this is what i get trying to run "no such file or directory"

Last login: Thu Dec 16 21:03:42 on ttys000
You have new mail.
RRs-Mac-Pro:~ randr$ ssh solar@192.168.1.52
solar@192.168.1.52's password:
Linux raspberrypi 5.10.63-v7+ #1488 SMP Thu Nov 18 16:14:44 GMT 2021 armv7l
Inetd.Com QC server - all activity monitored and logged.
Last login: Thu Dec 16 21:05:01 2021 from 192.168.1.52
solar@raspberrypi:~ $ ./RenogyWanderer.py
-bash: ./RenogyWanderer.py: No such file or directory
solar@raspberrypi:~ $

Ah ok well just saw fix from joe to solar so let me redo those steps and see if i can get a bit closer
 
so i think that is issue i dont know how to install your code i try and get these errors:
root@raspberrypi:/home/solar# sudo apt-get install git@github.com:BarkinSpider/SolarShed.git

Reading package lists... Done
Building dependency tree... Done
Reading state information... Done
E: Unable to locate package git@github.com:BarkinSpider
E: Couldn't find any package by glob 'git@github.com'
E: Couldn't find any package by regex 'git@github.com'
root@raspberrypi:/home/solar# ls
Dev prometheus.yml restartSys.sh
root@raspberrypi:/home/solar# ls
Dev prometheus.yml restartSys.sh
root@raspberrypi:/home/solar# git@github.com:BarkinSpider/SolarShed.git^C
root@raspberrypi:/home/solar# sudo apt-get install https://github.com/BarkinSpider/SolarShed.git
Reading package lists... Done
Building dependency tree... Done
Reading state information... Done
E: Unable to locate package https://github.com/BarkinSpider
E: Couldn't find any package by glob 'https://github.com/BarkinSpider'
E: Couldn't find any package by regex 'https://github.com/BarkinSpider'
root@raspberrypi:/home/solar# gh repo clone BarkinSpider/SolarShed
bash: gh: command not found
root@raspberrypi:/home/solar#

maybe need to clone it? i just dont know this part at all
 
ok figured it out i think but get Permission denied


root@raspberrypi:/home/solar/SolarShed# ls
exportData.sh getMPPSolar.sh GrafanaEpever.json GrafanaRenogy.json powerMeter.py README.md
getChargeryData.py getTracerData.py GrafanaMPPSolar.json 'Pi Setup Cheat Sheet' Readme-Epever-Triton RenogyWanderer.py
root@raspberrypi:/home/solar/SolarShed# ./RenogyWanderer.py
bash: ./RenogyWanderer.py: Permission denied
root@raspberrypi:/home/solar/SolarShed#
 
ok! i fixed Permissions and change address to 255 in code and now get this:
root@raspberrypi:/home/solar/SolarShed# ./RenogyWanderer.py

Traceback (most recent call last):
File "/home/solar/SolarShed/./RenogyWanderer.py", line 271, in <module>
readRenogy(file_object)
File "/home/solar/SolarShed/./RenogyWanderer.py", line 75, in readRenogy
register = renogy.read_register(0x100)
File "/usr/local/lib/python3.9/dist-packages/minimalmodbus.py", line 258, in read_register
return self._genericCommand(functioncode, registeraddress, numberOfDecimals=numberOfDecimals, signed=signed)
File "/usr/local/lib/python3.9/dist-packages/minimalmodbus.py", line 697, in _genericCommand
payloadFromSlave = self._performCommand(functioncode, payloadToSlave)
File "/usr/local/lib/python3.9/dist-packages/minimalmodbus.py", line 781, in _performCommand
request = _embedPayload(self.address, self.mode, functioncode, payloadToSlave)
File "/usr/local/lib/python3.9/dist-packages/minimalmodbus.py", line 962, in _embedPayload
_checkSlaveaddress(slaveaddress)
File "/usr/local/lib/python3.9/dist-packages/minimalmodbus.py", line 2081, in _checkSlaveaddress
_checkInt(slaveaddress, SLAVEADDRESS_MIN, SLAVEADDRESS_MAX, description='slaveaddress')
File "/usr/local/lib/python3.9/dist-packages/minimalmodbus.py", line 2276, in _checkInt
_checkNumerical(inputvalue, minvalue, maxvalue, description)
File "/usr/local/lib/python3.9/dist-packages/minimalmodbus.py", line 2321, in _checkNumerical
raise ValueError('The {0} is too large: {1}, but maximum value is {2}.'.format( \
ValueError: The slaveaddress is too large: 255, but maximum value is 247.
root@raspberrypi:/home/solar/SolarShed#
 
Found minimalmodbus module.py edited the max from 247 to 255 but now get cant read from instrument so maybe usbport? looking into that next
 
I'll be dipped! I think it works...LMAO!
 

Attachments

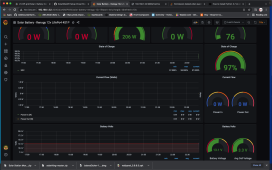
  • Screen Shot 2021-12-16 at 10.54.31 PM (2).png
    Screen Shot 2021-12-16 at 10.54.31 PM (2).png
    300.3 KB · Views: 35
Everything was working but came home tonight and now prometheus wont load. Welp.... maybe ill reformat and start from scratch again and see if i can step through everything better this time.
 
Ok @BarkingSpider Stepped through everything again and all works when i run RenogyWandere.py manually(though i dont think its updating but rather pulls data once) here is where i am stuck:
# add our scripts to rc.local before exit 0
vi /etc/rc.local

# Enable rc.local to start scripts
chmod +x /etc/rc.local
# Add before end of file
(/home/solar/restartSys.sh) &
domainname inetd.com
 
I'm going to go out on a limb here because I'm pretty desperate. I had a similar setup with a different "SolarShed" (corbinbs/solarshed), connected to a Renogy Rover charge controller. Everything was feeding nicely into Prometheus and I had a sweet dashboard setup in Grafana. I was connecting from Raspberry Pi 3 USB to RJ-11 port with this combo:

USB to Serial Adapter (https://www.amazon.com/dp/B00425S1H8?psc=1&ref=ppx_yo2_dt_b_product_details)
Female DB9 Pin (https://www.amazon.com/dp/B074Z3PWNY?psc=1&ref=ppx_yo2_dt_b_product_details)
And RJ-11 cable with wires:
1 TX (White) to DB9 box wire 2
2 RX (Black) to DB9 box wire 3
3 GND (Red) to DB9 box wire 5

Everything was working great until I tried two bonehead things.
  1. I tried to have both the Renogy BT-1 bluetooth adapter and the serial to USB plugged in at the same time using a generic phone splitter, which obviously didn't work
  2. I downloaded the newer Renogy DC Home app to see what it would offer monitoring-wise
After I connected to my charge controller with the Renogy app and decided it was crap compared to what I had, I plugged my Raspberry Pi back in and tried to resume monitoring with Grafana. And now I'm getting the following errors from minimalmodbus:
Bash:
some problem occurred: No communication with the instrument (no answer)
Traceback (most recent call last):
  File "server.py", line 43, in <module>
    print('Model: ', controller.model())
  File "/home/pi/.local/lib/python2.7/site-packages/solarshed/controllers/renogy_rover.py", line 41, in model
    return self.read_string(12, numberOfRegisters=8)
  File "/home/pi/.local/lib/python2.7/site-packages/minimalmodbus.py", line 443, in read_string
    numberOfRegisters=numberOfRegisters, payloadformat='string')
  File "/home/pi/.local/lib/python2.7/site-packages/minimalmodbus.py", line 697, in _genericCommand
    payloadFromSlave = self._performCommand(functioncode, payloadToSlave)
  File "/home/pi/.local/lib/python2.7/site-packages/minimalmodbus.py", line 795, in _performCommand
    response = self._communicate(request, number_of_bytes_to_read)
  File "/home/pi/.local/lib/python2.7/site-packages/minimalmodbus.py", line 930, in _communicate
    raise IOError('No communication with the instrument (no answer)')
I've checked and double checked my cable pin-outs with a multimeter. I'm not sure if one of two things happened.
  1. The USB to serial adapter got fried when I plugged both it and the bluetooth adapter into the RJ-11 port
  2. Connecting with he Renogy DC Home app installed new firmware that prevents rogue agents from talking to the serial port
I know this isn't your software, but just curious if you've ever seen something like this happen (firmware updates or fried USB adapters).

I'd really like to get it working again. I'd consider trying your software, but I didn't see explicit support for my charge controller. It might be easy enough to create a Renogy Rover module given that the existing software makes it pretty easy to understand which registers it's reading (I'm a software engineer by trade, so creating something like this is within my wheelhouse).

Again, thanks for reading if you got this far. Any thoughts you might have are really appreciated!

thanks
scott nichol
I would bet your Devicename (ID) changed from 1 to 255 you can see id in Renogy app under device info
 
It isn't working too well, is it.

Screenshot_1223_031806.png

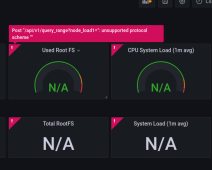
I enter node_load1, press Execute, and nothing happens. Is something supposed to?

Then, I'm getting "unsupported protocol scheme" all over the place. Probably because of that.

Screenshot_1223_033259.png

Any suggestions?
 
Id say Prometheus is not running or installed properly. also node_exporter install needs to be setup to "--collector.textfile.directory=/ramdisk"
Im not an expert but thats my guess
 
Prometheus looks like it's running, or I wouldn't get the web menu, would I.
But just to be sure, if you enter "node_load1" there, does it do anything? Like what?
 
well we need more info....
what does Promethuseus status show? "sudo systemctl status prometheus" same with node_exporter what does status show?
Also did you add Prometheus as data source in grafana?
did you edit prometheus.yml?
cat > prometheus.yml
# Global config
global:
scrape_interval: 10s # Set the scrape interval to every 15 seconds. Default is every 1 minute.
evaluation_interval: 15s # Evaluate rules every 15 seconds. The default is every 1 minute.
scrape_timeout: 10s # scrape_timeout is set to the global default (10s).
#
# Test with
# ./promtool check config prometheus.yml
# and tail /var/log/messages
#
scrape_configs:
#
# Unix server data
- job_name: 'node'
static_configs:
- targets: ['localhost:9100']
 
Code:
~$ sudo systemctl status prometheus
Unit prometheus.service could not be found.
Same for node_exporter.

But, http://localhost:3000/ shows a Grafana "homepage":
Screenshot_1223_214151.png

and http://localhost:9090/ a Prometheus one.
Now, when I add a Prometheus data source, I get "Error reading Prometheus: Post "/api/v1/query": unsupported protocol scheme """

The Prometheus configuration is much the same as yours, except I have job_name: prometheus and the target is localhost:9090
 
All this said, I have it running on KDE neon - which is Ubuntu 20.04 - and, protocol schemes notwithstanding, it just shows that running it on a Raspberry is pretty much a waste of resources. Why not just use a Debian-based Linux distro on a full-fledged computer instead. It's not that hard to install and dual-boot. or run in a virtual machine, is it.
 
Back
Top