diy solar

diy solar

EVE-280 cells should these be clamped tight or spaced for expansion?

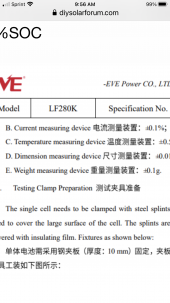
I also wonder, after looking at their test fixture again, how they measure force at all. I would think that they would describe how they are measuring force.
Dimension measuring device
Weight measuring device
 

Attachments

  • 3B367B80-61D1-4200-A5AB-180DE77A94A3.png
    3B367B80-61D1-4200-A5AB-180DE77A94A3.png
    1,000 KB · Views: 28
Cool. Now tell us how YOU measure that.
No idea, I really would like to know what THEY mean by "300kgf"

Interesting. Your specification is apparently a swelling force test, not a compression specification for long-term cell use. What does the title sheet say?

The 230Ah cell datasheet I have simply says to keep the cells in a 300kgf fixture. Mine seem happy so far in boxes with Poron sheet providing the compression.
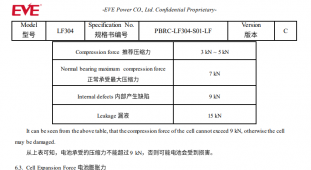
First pic should be about capacity test procedure, second pic is under "Parameters Recommendation for Module Design"

We shuld pay between all of us, an hour of consultation with the EVE engineers! ;)
I'm in!(if i'ts not too much though)
 
Dimension measuring device
Weight measuring device
But they don't show either in the test fixture. If the fixture doesn't have it, they aren't measuring anything while in the fixture.

No idea, I really would like to know what THEY mean by "300kgf"


First pic should be about capacity test procedure, second pic is under "Parameters Recommendation for Module Design"


I'm in!(if i'ts not too much though)
OK, I'll continue the Snipe Hunt: Please post the entire paper you found, or a link to it.
 
Last edited:
I highly doubt even an hour with their engineers would clarify this topic. That's just my hunch.
I'm sticking with my post from June 6.

A conservatively designed system obviates the need to reach to the extremes of charge and discharge, and thus the cause of puffing in the first place.

If you're using compression rods, all-thread for example, just snug them up so the cells can't puff. They don't need actual compression.
Don't over-charge them, don't over-volt them - that will prevent them from puffing in the first place.
 
Hmm, looking at LF304 datasheet - aluminium plates are 8mm (vs 10mm for 280K), EOL expansion force under 30kN(vs 280k 50kN)
Dimensions are pretty much the same between 280 and 304...

But here is the weird discrepancy:


1661969197663.png

Leakage force is 15kN (LF 304) vs 100kN (LF280K)
Any clues?
 
Seems it has not been added to resources

Edit: Added now
Battery Cell Data Sheets
Thank you very much. I had not seen that thread at all.

After reading the entire datasheet, it seems that Eve has modified their original specification to include new testing. As I recall, they had originally told us that allowing the clamping force to exceed roughly 18 PSI (~460kgf = 4.5kN on the face) was a bad thing, and detrimental to cell lifetime. They still suggest that for the initial force (<5kN), but now they go on to say that cells in normal use (from the 230 Ah specification) will not exceed 7kN = 1,570 lbf, or 28 PSI on the face. Apparently 18 PSI was not such a bad thing after all. It is, of course, possible that they include this testing now because a lot of EV makers would prefer to weld a case up and not worry about compression foam.

I think the higher forces in their tables are at end of life or if other cell problems occur, meaning that your fixture should be strong enough to handle those forces.

By the way, for those of you who simply snugged yours up and finger-tightened the bolts, the 300kgf is achievable with bar clamps. I calculated the distance I needed to compress my foam (after testing the foam with a scale on a press stand). I then created my enclosures using mean cell and separator thicknesses plus the compression distance needed. When I assembled the enclosures, I used two Irwin Quick-Grip clamps to compress the stack together with the end plate and install the holding screws. For all five enclosures I made, the Quick-Grip clamps were barely able to compress the stack enough to line up the screw holes (installed from the sides). In other words, the Quick-Grip style of clamp seems just capable of providing about 300kgf when you use both hands to tighten them. Using those clamps and then hand-tightening your fasteners should get you close to the specification.
 
By the way, for those of you who simply snugged yours up and finger-tightened the bolts, the 300kgf is achievable with bar clamps. I calculated the distance I needed to compress my foam (after testing the foam with a scale on a press stand). I then created my enclosures using mean cell and separator thicknesses plus the compression distance needed. When I assembled the enclosures, I used two Irwin Quick-Grip clamps to compress the stack together with the end plate and install the holding screws. For all five enclosures I made, the Quick-Grip clamps were barely able to compress the stack enough to line up the screw holes (installed from the sides). In other words, the Quick-Grip style of clamp seems just capable of providing about 300kgf when you use both hands to tighten them. Using those clamps and then hand-tightening your fasteners should get you close to the specification.

I have the Quick Grip clamps, but used the old school Pony Clamps this time.

1661972976633.png

Ignore the voltage on the power supply. I had just bumped with my hip or something. It was at that voltage only for a moment.
 
I have the Quick Grip clamps, but used the old school Pony Clamps this time.
Pony clamps were my fallback. Anyway, my experience shows that Quick Grips max out at right at 300kgf, making them perfect for a rather blind application of compression force for these cells.
 
Hmm, looking at LF304 datasheet - aluminium plates are 8mm (vs 10mm for 280K), EOL expansion force under 30kN(vs 280k 50kN)
Dimensions are pretty much the same between 280 and 304...

But here is the weird discrepancy:


View attachment 109567

Leakage force is 15kN (LF 304) vs 100kN (LF280K)
Any clues?
I can bring some clarity in that aspect, being survivor (with damage) of the 100-120-135-152Ah casing.

Same casing used for 100 and 152Ah cells, what can go wrong...??

Exactly this.
When you put more sheets in the same casing, lots of things change, like less force..

Also, the 152Ah could not be used free standing, they expand (bloat) just too many sheets in a small container.

List of (possible) problems continues.

With higher capacity cells, and most of the time higher capacity used for charge and discharge, your error margin is reduced.
Where you could use a bolt at 20A, with 40A you already need a stud, increased strength to the terminal using loctite or similar.
At 50 or 60A, laser welded studs or busbars get mandatory.

Not even talking about additional safety like clamping here...

@Browneye , I totally agree that you should make the setup as safe as possible and stay far from the top and low of "possible".
Usually the "possible" is under laboratory optimal conditions, and where in "the west" often 10% is reduced for safety, in "the east" 10% is added for better sales :)

How to really know the clamping force?
Or the force pressing the busbar on the terminal?

Not for us mortals without expensive equipment, and even then, there will be variations in each setup.

Robots and production hall, different from DIY at home.
Just a tiny bit ?

Usually there is the "China margine" of 1/3.

150A breaker, use on max 100A (and even that, not continuous)
3000W inverter, don't go beyond 2000W (except some peaks)
List goes on.

If you would use the 280 or 304Ah to -200Ah, staying from the top and bottom..

Use capacity reasonable for the setup (not laser welded? Stay under 40A!)

Compression is one of the least worries.
And as it's almost impossible to measure...
(For DYI) a "snug fit" is good enough.
You can put force on the side of the casing, as the cells bend inward when you received them (a bit look like this )( ... Binoculars glass) all your force is on the thin aluminium side walls.

When they start to expand, going from )( to || and eventually (), the snug fit will provide all force automatically.

One problem will be with too much sheets in a cell, that allowing any space for () and afterwards returning to ||, can/ will give internal shorts, self discharge and all kinds of nastyness.

We know the 280 are stable.
Don't know much about the 304 or the 320 in the same housing.

We do know that the stable 100 and 120ah suddenly became a probelm with 152.

Just be careful buying higher capacity in the same casing.
It is known to give problems in the past.
 
So after a year sitting in the driveway I had my battery apart, and can report the Poron foam I used is holding up well and still seems to be appropriately "springy". I built mine more or less the same way as @justgary by measuring the total stack width and subtracting the foam compression thickness per it's spec sheet (since its an engineered product specifically designed for compression). I also lined the bottom and long sides with some cheap thin neoprene foam just for a bit of additional cushion.

So far in my opinion that's the way to go. Even if the compression itself ends up being meaningless for our uses, it provides cushion, insulation, and room to move slightly.
While its not a hard clamped 300kgf fixture of the tests and will actually slightly increase pressure as the cells swell, its still compression more or less within the acceptable range.

I think this is an acceptable trade-off for the additional protection the foam offers considering its mounted in a trailer and subject to all manner of vibration and bumps.

Time will tell if this thing lasts another 10+ years.
 
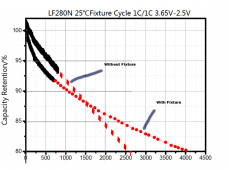
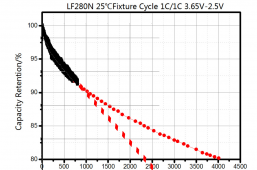
I did not read the entire discussion .. but .. saw something strange :

Image1.png
In this picture i used the scale to put those lines on the same scaled graph.

Let's say :
Type A - With Fixture
Type B - Without Fixture

The A pack lost capacity faster then the B
2 conclusions are possible :
1 - Compression intialy increase aging of the pack
2 - Their test as been badly done, let's say .. only once .. (one pack was already weaker then the other one) and nothing can be conclude about it.

Other conclusions that could be done :
A - A and B at 1500 cycles will have the same capacity
B - At 2500 cycles, roughly 4% difference in capacity between A and B
C - Visually ... the decay of the B is linear while the A is logarithmic

So ... having a fixture would FIRST (before 1500 cycles) be worse then not having a fixture ... and at then would become better ... something is wrong here. There could be a combination of chemical reasons for that .. but still .. it look like the test done by EVE is the problem and that those 2 curves can't be trusted.


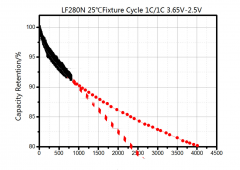
In this picture i put each line start on the same point while keeping the good scale on x and y.

Image6.png

Conclusions that can be done :
AA - EVE is doing a poor job in their test, their 2 graphs are not starting at 100% ...> shity conclusions.
BB - A or B they both got a similar capacity degradation till 1000 cycles (maybe the thick line is including uncertaintie, dunno)
CC - Between 1000 and 2000 cycles : A lost 3.85% while B lost 7.5%, we can roughly say that B is losingf capacity twice faster.
 

Attachments

  • Image3.png
    Image3.png
    325.1 KB · Views: 3
  • Image4.png
    Image4.png
    272.6 KB · Views: 4
Last edited:
There are 2 things that make me wonder for a long time

First, what is a cycle.
Discharge 33% is one cycle, or discharge (and recharge) 33% 3 times (days) is one cycle??

Second the influence of the C..
The test is done at C1.

Most of solar installations go way below C0.2

Standard "battery knowledge" say that faster charge and discharge will reduce battery life.
Or, other way around, slow charge and discharge...
Longer battery life??

If 3 X 33% is 1 cycle and C0.2 does "extent" battery life..

2500 X the charge/discharge you have per day.
(For me -50%)
That is 5000 days.

Then increase the +13.5 years with the longer lifetime due slower charge and discharge...

And that the battery is supposed to have maximal 20 years of "life cycle"

I wonder if we even should care about clamping..

But...
If the 33% discharge and recharge to "full" is a cycle...
Then it goes aot faster.

(I charge up to 90% on Daily basis, discharge max to 10%, average 35% discharge at night)

Besides this...
Battery capacity reduction seems to be linear.

So, 2500 cycles, 80%
5000 cycles 60%
7500 cycles 40%.

With my average usage...
That's usable for 20 years, even if my 35-40% discharge-recharge per day counts as a full cycle

Thrust me..
In 15 years you probably are replacing your inverters anyways.. (give or take a few years longer or lesser, I hope for you longer)
And time to review your setup.

15 years is a long time...
Heatpumps will be "standard", and our electricity consumption will be different.

Hopefully lower.

For most installations...
The battery will outlast the installation??
 
Last edited:
There are 2 things that make me wonder for a long time

First, what is a cycle.
Discharge 33% is one cycle, or discharge (and recharge) 33% 3 times (days) is one cycle??

Second the influence of the C..
The test os done at C1.

Most of solar installations go way below C0.2

Standard "battery knowledge" say that faster charge and discharge will reduce battery life.
Or, other way around, slow charge and discharge...
Longer battery life??

If 3 X 33% is 1 cycle and C0.2 does "extent" battery life..

2500 X the charge/discharge you have per day.
(For me -50%)
That is 5000 days.

Then increase the +13.5 years with the longer lifetime due slower charge and discharge...

And that the battery is supposed to have maximal 20 years of "life cycle"

I wonder if we even should care about clamping..

But...
If the 33% discharge and recharge to "full" is a cycle...
Then it goes aot faster.

(I charge up to 90% on Daily basis, discharge max to 10%, average 35% discharge at night)
My point of view ... i do not say hthat i'm right.

- One cycle is 100% of the battery ... 10x10% = one cycle, 3x33% = one cycle.
- Lower C = more battery life and lower degradation, till a certain point where it got no impact, as an idea .. let's say that the battery will not age faster at 0/1C that it does at 0.2C. But will clearly degrade faster at 2C then at 1C => depend on the distance with the designed limit of the cell. It' smore like a "border" effect, how thick is this border .. i dunno.
- About lifetime, no .. cause those graph do not include time aging cause they certainly did their test in a limited amount of time (i suppose). LIke a new car put in a garage for 30 years will age even if not used, a cell will age. Now a car lightly used and not abused will age slowly then an heavily used and abused car, same applied for a cell .. abusing is high C and heavily using them are cycles.
There are special aging tests for just about everything, without really need to pass the 10 or 20 year.

Usually those are quite accurate.
I can say from experience that the small lithium cells LR44 lasted 11 years..
Not rechargeable, and back then the lifetime was 10 years.

20 years ago the LR44 (probably) didn't exist yet.

I'm fairly confident that this 20 year is "accurate".
You might get lucky, 25 year, but won't get 30
 
For LF280N cell, at 1 C(A) discharge there is 30 to 80 watts of internal cell heating depending on aging of cell.

It could be argued a lack of compression testing fixture heat sinking is reason for accelerated degradation.
 
Last edited:
There are special aging tests for just about everything, without really need to pass the 10 or 20 year.

Usually those are quite accurate.
I can say from experience that the small lithium cells LR44 lasted 11 years..
Not rechargeable, and back then the lifetime was 10 years.

20 years ago the LR44 (probably) didn't exist yet.

I'm fairly confident that this 20 year is "accurate".
You might get lucky, 25 year, but won't get 30
I do not think you can simulate time that easily you can do real test, let's say for a year and then do a projection which could be accurate or could be completly wrong, cause sometimes some factors arise after a certain time that weren't there at first.
I think it's pretty hard to do a projection when time factor is important.

Let's say IKEA is puting a test for door hinges, they got robots that open and close doors thousands of times a day, in a way that simulate aging ... but it's abstracting time aging. It's not a real problem with an aluminium tube for example on which tilme got near no impact, but some palstic for example, age really badly ... it's a vast subject.
 
Good point.

But... Charge at C0.1 (or so)( max C0.3) and discharge for 14 hours, 50%.... I'm too lazy to do the math on that one...
Way under C0.1 :)

As result.. low wattages..
And lower degradation.

I think most solar users charge in 5-8 hours what they use in the 12-14 hours the battery is used.
 
I do not think you can simulate time that easily you can do real test, let's say for a year and then do a projection which could be accurate or could be completly wrong, cause sometimes some factors arise after a certain time that weren't there at first.
I think it's pretty hard to do a projection when time factor is important.

Let's say IKEA is puting a test for door hinges, they got robots that open and close doors thousands of times a day, in a way that simulate aging ... but it's abstracting time aging. It's not a real problem with an aluminium tube for example on which tilme got near no impact, but some palstic for example, age really badly ... it's a vast subject.
Yeah, it's a science.

When you Google about the aging tests then you find a lot.

It's quite amazing what they can do nowadays.

Simulation, sure, galvanized iron doesn't (fully) rust in 20 years inside soil.
Depending on acid levels, soil type, temperature etc etc etc..

But... Their tests show that it most likely will be good for at least 15 years.
And if you have the best possible combinations probably double of this.

Even real age tests are inaccurate as 20 years is a long time.

Is that constant temperature?
What charge level?
Cycles?
Etc etc etc.

Still the small 11 year old lithium cells where rated 10 years and have been "abused" by temperature of -15 to +40c..

Quite accurate:)

It's about managing expectations, not exact science

Side note on plastic..
In Europe (Holland) plastic (PVC) lasts a long time. Decades.
Here in Thailand it's eaten away in a few years.
Yet car paint (no rust) stays good for a long time.. and in Holland ... Not
 
For LF280N cell, at 1 C(A) discharge there is 30 to 80 watts of internal cell heating depending on aging of cell.

It could be argued a lack of compression testing fixture heat sinking is reason for accelerated degradation.

Where did you get those numbers, 30W and 80W ? That seems pretty high to me... would mean a pack of 16 cells would generate between 480W and 1260W .... when under 1C.
 
Back
Top