diy solar

diy solar

Lifepo4 - ideal charging parameters?

Yeah it's $5 so not MPPT.
True but surprisingly it is more efficient (92% against 89%) than my new true mppt charge controller, although that one can pass 2.5 more Watts into the battery since it has no 1A current limitation like this mppSET buck converter. But the size and weight difference is huge!!

Since portability is important for me I prefer this efficient small mppset buck converter. As well it still produces 14.7w which is an 58% upgrade in compare to the 12.5w 7.4v panel (Real life output only 8.6w into the battery because of an inefficient buck converter as I found now out) which I used for months to charge a powerbank to drive everything I need.

Sadly I am not capable nor do I know someone who could exchange the resistor on this converter to change the current limitation from 1a to 1.5a. That would be ideal in order to get the remaining available 2.5w out of this 20w panel! Well hopefully one day I am lucky to meet such a capable person! :)
 
Last edited:
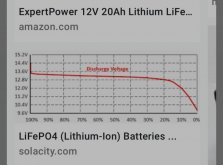
I do have an Ahr counting meter and also a PowerLab 6 which would give me the exact number. I could look up some tests I did a few months ago but it doesn't matter what the exact number is to me. What I have found is that when I try to go above 3.4 volt per cell on my 16S pack there is one or two cells that seem to want to sprint to 3.6. I thought I did a pretty good job of parallel top balancing but as others have said these cells have bigger variations during the knee of the charge curve. The chart I had linked to actually said that 3.375 or 13.5 for a 4 cell pack was 98%. I can't tell from the data whether that was a charge or discharge chart. Whomever plotted it decided to plot the chart from the table which just had values in descending order. The scale of the chart does not appear to be linear so it flattens the typical knees which are steeper if the horizontal scale was linear.
The other thing to understand is that it depends on the current and I don't have testing equipment that can go up to the real time current that my system can put on my pack in normal use.
Whether it is a charge or discharge chart is easy to distinguish, in a charge chart the curve goes ? and in a discharge chart the curve goes ?. :)
IMG_20201207_204705.jpg
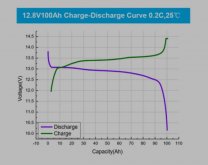
As you can see the voltage readings are completely different at the same soc.
Example: 70%soc while discharging (on the above chart) reads 12.95v. On the other hand 70% while charging reads 13.5v.
 
Or is there a faster way to figure out the threshold I am looking for?
Yes, use the data points from your testing device and pick a point where the charging curve brgins to rise rapidly. Is your goal to be exactly 10 per cent from the top or reduce the risk of cells getting over charged?
 
Last edited:
Whether it is a charge or discharge chart is easy to distinguish
Yes, especially when they are labeled as in your picure. However the particular chart I linked to is plotted from a table and if you know how that is done one can plot up the table or down the table. The result will be a chart that goes up from right to left or up from left to right.

Despite the direction the unknown plotter chose to go several additional pieces of information suggest that it is a likely charge curve. One, a note says "do not charge below.....". Two, the voltage at 90 percent looks like what one would observe for a LFP charge curve. Three, the percentages increase as the voltage increases.
 
Last edited:
Yes, use the data points from your testing device and pick a point where the charging curve brgins to rise rapidly. Is your goal to be exactly 10 per cent from the top or reduce the risk of cells getting over charged?
Thanks, good idea! I will record with a smartphone the display (don't want to sit hours next to it) of the testing device to review later at which point the knee happened.

My goal is only to protect the pack from being overcharged/ from being permanently damaged.
 
Yes, especially when they are labeled as in your picure. However the particular chart I linked to is plotted from a table and if you know how that is done one can plot up the table or down the table. The result will be a chart that goes up from right to left or up from left to right.

Despite the direction the unknown plotter chose to go several additional pieces of information suggest that it is a likely charge curve. One, a note says "do not charge below.....". Two, the voltage at 90 percent looks like what one would observe for a LFP charge curve. Three, the percentages increase as the voltage increases.
Well the percentage always increases as the voltage increases ?... But you are right about the 90% mark, that looks more likely like a charge curve since i have hardly ever seen a discharge chart with comes close to 13.4v at that mark except this one which is 13.3v at 90%, but usually way under.
IMG_20201209_072713.jpg

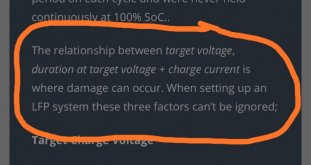
But I think I get the issue why the charts you find differ so much after reading this
IMG_20201209_073814.jpg
Because the circumstances are different and they matter!

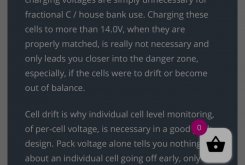
Also I learned a point I underestimated
IMG_20201209_073940.jpg
Means I have to tear my battery pack cover apart again and start monitoring my cells a bit. Can't trust my cheap 2usd bms a millimeter which I also learned. It cuts off only at 14.8v as well can't change that.

Many thanks for your input pointers and good ideas!
 
I guess there is no way around to invest in bench equipment in order to do proper capacity measurements and to safely top balance the cells.
Switching to lifepo4 turned out to be more of a hassle then it looked on YouTube... ?
 
Update: I did a few tests in the sunny morning
IMG_20201210_094743.jpg

Good news the mppSET boost charge controller stopped at the target voltage of 13.8v and current went to 0! Very happy about that. Before that at 13.6v I started to notice a small but steady wattage and current decrease (absorbtion stage I guess started, the knee was hit or about to be hit) and when I came back 15min later it had already been switched off since 13.8v had been reached during that time period away.

Day before charging the voltage was
3.342v
3.342v
3.334v
3.308v

I charged with about 0.17c (the maximum of this charge controller = 14.2w output)
After a few minutes of charging I measured again
3.335v
3.343v
3.339v
3.342v

After the charger cut off at 13.8v the voltage was
3.35
3.34
3.35
! 3.59v!! This was the battery on which the negative pole from the bms was attached to.
13.36v the whole pack

After that I discharged it a little and charged up to 14v which happened very quickly.
The out of order cell went up to 3.67v, the difference to the rest of cells was now 0.3v!

After 2hours of resting the battery, I checked again
3.348
3.342
3.345
3.413
13.45v the whole pack.

Result: my cells are heavily out of balance. I heard up to 0.02v is acceptable, mine were 0.3v apart.
Now I have to wait until I get a bench power supply and capacity measurement tool from China to see how much the capacity of the cells match and to attempt to top balance the cells properly.
 
Strange, after again a few hours the out of balance cell also settled to around 3.34v like the others.

Does your anode connected cell also behave like mine? Is it normal or not?
 
Back
Top