What are you calling a cycle?Notice the end of discharge voltage decay drop off on cell 303.
It is quite different of the other cells and is indicative of a cell that has not had enough initial cycles where the cathode and anode capacity curves have not reached their final alignment. It may gain in AH's after a few cycles. It would surprise me they did not catch this and do more cycles to correct.
It is also possible the neg anode graphite print thickness was on the thin side so anode does not have the extra 15-20% graphite. This would be bad as not only will it produce less AH's of capacity but it will also age quicker than other cells. This would be a manufacturing process control screw up. (something that never happens in China)
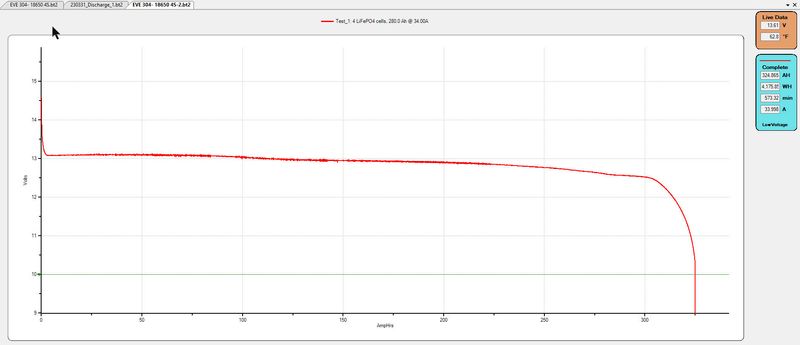
These graphs are plotted with X axis in incremental AH's consumed, not the time increments that the zketech plots out.
View attachment 142705
View attachment 142713


You are using an out of date browser. It may not display this or other websites correctly.
You should upgrade or use an alternative browser.
You should upgrade or use an alternative browser.
EVE 304 Cells from 18650batterystore & zke-40 testing.
- Thread starter Sam Cho TX
- Start date
We had a ZKE here and found it quirky and not quite as accurate as I wanted. I Just top balanced and ran two charge discharge cycles on four EVE 304's from 18650. For this discharge test I used our CBA-V Pro with a 500W amplifier. This thing is accurate and agrees with our NIST calibrated Fluke. Also, cross checked current with our Rigol O-scope and our reference shunt. Results harken back to the early days and Thundersky cells coming in consistently over spec. No complaints with 324.86Ah
RCinFLA
Solar Wizard
- Joined
- Jun 21, 2020
- Messages
- 3,564
Probably too much info here but include it anyway. It may be informative to some individuals.
There are two visible bumps in the discharge curves at about 65% SoC and about 20-25% state of charge caused by anode graphite intercalation (stuffing lithium-ion into graphite lattice layers). It is more visible during charging. The bumps diminish in visibility at higher cell current where overpotential voltage slump dominates.
If you examine the two graphs of cell 303 and 305 you can see the anode graphite intercalation bumps shifted to left on cell 303. It says anode is root of issue, likely either not charge state aligned with LFP cathode or insufficient graphite layers thickness.
This graph is the negative electrode graphite potential versus charge intercalation level on graphite and is the reason for cell voltage dips and decay between 98% and about 20% state of charge of cell. Positive LFP electrode potential is almost flat, about 3.433v at OCV, across that SoC range.
It is flipped left to right from normal cell discharge curves. Total discharge state is on the left side. Again, the graphite potential subtracts from cathode electrode potential to give net cell voltage. This graph is also for graphite anode that has gone through initial manufacturing charge forming to grow Solid Electrolyte Interface (SEI) protective layer over graphite granules.
Alkaline
Solar Wizard
Someone else had mentioned the ZKE not being accurate they also said knock off ZKE are hitting the market but now I dismissed it but I'm wondering if there is something to it.
I also I'm finding the 281 on first attempt and 297 on the 2nd attempt to be kinda nuts. I saw the graphs and opened up the zke software, Sam is correct those were the readings and the cell was like 3.5v when it started so it was fully charged. May the Tester is off?
Sam, where did you buy the ZKE from? Aliexpress?
BTW Andy did a video a while back saying the ZKE can overcharge/discharge if not connected to a PC, it worked properly for him but the guy who had Andy do a test swears it overcharged his cell.
Alkaline
Solar Wizard
Notice the end of discharge voltage decay drop off on cell 303.
It is quite different of the other cells and is indicative of a cell that has not had enough initial cycles where the cathode and anode capacity curves have not reached their final alignment. It may gain in AH's after a few cycles. It would surprise me they did not catch this and do more cycles to correct.
It is also possible the neg anode graphite print thickness was on the thin side so anode does not have the extra 15-20% graphite. This would be bad as not only will it produce less AH's of capacity but it will also age quicker than other cells. This would be a manufacturing process control screw up. (something that never happens in China
These graphs are plotted with X axis in incremental AH's consumed, not the time increments that the zketech plots out.
View attachment 142705
View attachment 142713
So the sharp drop means something is up with the cell then. Nice catch.
Sam Cho TX
Solar Enthusiast
It took 28 hours to fully charge these cells. I'm going to run a capacity test using a heater with an inverter. I'll set it to the 750 watt mode which is close to about .2c load.
sunshine_eggo
Happy Breffast!
It took 28 hours to fully charge these cells. I'm going to run a capacity test using a heater with an inverter. I'll set it to the 750 watt mode which is close to about .2c load.
with BMS installed?
Sam Cho TX
Solar Enthusiast
No 28 hours to balance charge with the zke-40 at 40 AMP charge. Anyway they are all charged and looking Good.
I'm using a sfk branded jbd 150a bms, I have this in my v3.5 kit and its been great so I borrowed one for my v4 kit to test these.
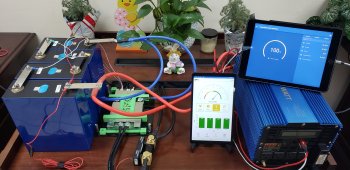
So I'll be using a 3000 watt sin wave inverter and a 1500 watt heater that has a low power mode (750 watt) to perform this test.
All cells reading 3.58, Beautiful
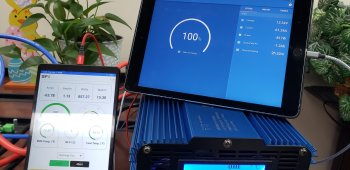
Test is running, I'll be recording the capacity using the victron smart shunt 500a and also using the benchmark recorder on the sfk app this way in case 1 messes up I'll still have results as I'm in no mood to recharge these cells.
The test is running and looks like it is drawing between 800-850 watts and the jbd is reporting 62 amps and the victron is reporting 60 amps draw so we are pretty close.
Using the Ipad to run the victron app and galaxy tab a7 to run the sfk app.
I'm hoping the ZKE was maybe a bit harsh and I can get 300 AH of real world usable capacity ? ?
I'm using a sfk branded jbd 150a bms, I have this in my v3.5 kit and its been great so I borrowed one for my v4 kit to test these.
So I'll be using a 3000 watt sin wave inverter and a 1500 watt heater that has a low power mode (750 watt) to perform this test.
All cells reading 3.58, Beautiful
Test is running, I'll be recording the capacity using the victron smart shunt 500a and also using the benchmark recorder on the sfk app this way in case 1 messes up I'll still have results as I'm in no mood to recharge these cells.
The test is running and looks like it is drawing between 800-850 watts and the jbd is reporting 62 amps and the victron is reporting 60 amps draw so we are pretty close.
Using the Ipad to run the victron app and galaxy tab a7 to run the sfk app.
I'm hoping the ZKE was maybe a bit harsh and I can get 300 AH of real world usable capacity ? ?
Attachments
sunshine_eggo
Happy Breffast!
Was referring to the discharge test with the BMS installed...
Sam Cho TX
Solar Enthusiast
Yes absolutely LOL ?I at least know this much
Sam Cho TX
Solar Enthusiast
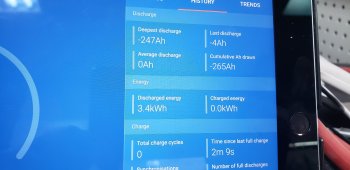
I just finished testing, and well I'm pretty ticked off tbh.
victron shunt said 265 and sfk app said 267 ah
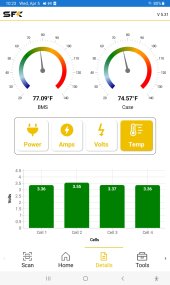
the sfk app recorder showed me some information:
Looks like cell 2 is just loosing power during the test the other cells are fine. If you go down to the cell voltage area you can see. What the hell this was the cell that tested to 306!
Here is how they are on the BMS:
Cell 1 : Label 305.6 AH - testing to 292 on the zke
Cell 2 : Label 303 AH - testing to 306 on the zke
Cell 3 : Label 305 Ah - testing to 317 AH on the zke
Cell 4 : Label 302 ah - testing to 297 on he zke
I don't understand thought for sure I would get at least 288 ish but cell 2 the one that tested to 306 only provided 265 Ah under like a 750-850 watt load.
This sucks!
victron shunt said 265 and sfk app said 267 ah
the sfk app recorder showed me some information:
Sun Fun Kits DIY LifePo4 Lithium Battery Kits & Ready Made AGM / Lead Acid Replacement Batteries for RV, Golf Carts, Solar Storage, Back Up Power, Hurricane Outage . Made in Baton Rouge, LA, USA Ready to Ship out no overseas delay! Sunfunkits.com
Sun Fun Kits DIY LifePo4 Lithium Battery Kits & Ready Made AGM / Lead Acid Replacement Batteries for RV, Golf Carts, Solar Storage, Back Up Power, Hurricane Outage . Made in Baton Rouge, LA, USA Ready to Ship out no overseas delay! Sunfunkits.com
www.sunfunkits.com
Looks like cell 2 is just loosing power during the test the other cells are fine. If you go down to the cell voltage area you can see. What the hell this was the cell that tested to 306!
Here is how they are on the BMS:
Cell 1 : Label 305.6 AH - testing to 292 on the zke
Cell 2 : Label 303 AH - testing to 306 on the zke
Cell 3 : Label 305 Ah - testing to 317 AH on the zke
Cell 4 : Label 302 ah - testing to 297 on he zke
I don't understand thought for sure I would get at least 288 ish but cell 2 the one that tested to 306 only provided 265 Ah under like a 750-850 watt load.
This sucks!
Attachments
Last edited:
Sam Cho TX
Solar Enthusiast
Notice the end of discharge voltage decay drop off on cell 303.
It is quite different of the other cells and is indicative of a cell that has not had enough initial cycles where the cathode and anode capacity curves have not reached their final alignment. It may gain in AH's after a few cycles. It would surprise me they did not catch this and do more cycles to correct.
It is also possible the neg anode graphite print thickness was on the thin side so anode does not have the extra 15-20% graphite. This would be bad as not only will it produce less AH's of capacity but it will also age quicker than other cells. This would be a manufacturing process control screw up. (something that never happens in China
These graphs are plotted with X axis in incremental AH's consumed, not the time increments that the zketech plots out.
View attachment 142705
View attachment 142713
OMG how did you know the 303 was going to be bad! It dragged the whole test down I was only able to get 267 Ah from the pack! Look at the report: https://www.sunfunkits.com/app/ViewBenchmarkDetails?id=a8d694597315
sunshine_eggo
Happy Breffast!
Did the BMS report a similar capacity?
Did you go until 2.5V cell dropout?
Did you go until 2.5V cell dropout?
Alkaline
Solar Wizard
Wow those results are bad! I say recharge and run it again just to be sure. Sunshine looks like the lowest cell went to 2.58 then it looked it like bounced back up on to down to 2.6 again.
Thats a neat graph, can you use the sfk app on a JBD 8s? I downloaded it but it did not detect it.
Thats a neat graph, can you use the sfk app on a JBD 8s? I downloaded it but it did not detect it.
sunshine_eggo
Happy Breffast!
Wow those results are bad! I say recharge and run it again just to be sure. Sunshine looks like the lowest cell went to 2.58 then it looked it like bounced back up on to down to 2.6 again.
Thats a neat graph, can you use the sfk app on a JBD 8s? I downloaded it but it did not detect it.
Thanks. I didn't scroll.
Sam Cho TX
Solar Enthusiast
I have been recharging to retry the test, but now the balance is completely off, its been running a charge for 18 hours now, I'm using a 50 amp lithium charger so I know it should have only taken max 6 hours to charge. 1 cycle is all it takes to throw off the balance on grade B?
Attachments
RCinFLA
Solar Wizard
- Joined
- Jun 21, 2020
- Messages
- 3,564
You will have a tough time keeping them in balance if you run a near full discharge, more than about 230 AH DoD. Absolute max discharge will be limited to ballpark of 280 AH, after which you will need to do some significant rebalancing. Only as strong as weakest link. Greater load current may make things worse.
You have two really poor cells from the data you attached, 304.1 and 303. Only 305 comes close to looking like a 304 AH cell. I would definitely leave 303 out of the series stack as it will cause greater misbalancing of cells during deep discharge.

You have two really poor cells from the data you attached, 304.1 and 303. Only 305 comes close to looking like a 304 AH cell. I would definitely leave 303 out of the series stack as it will cause greater misbalancing of cells during deep discharge.
Last edited:
Alkaline
Solar Wizard
Under that 62 amp test the 303 cell only tested to 267, yet was testing to 306 under a .1c load did you see the result from the bms, I can't say I have seen such a big drop going form .1c discharge to .2c discharge.
Checkthisout
Solar Wizard
- Joined
- Nov 14, 2021
- Messages
- 4,810
My problem with your tests, how do you know your equipment is accurate to the margin you're trying to test to?
What makes you think your setup is capable of doing 100% accurate tests and that you are doing the tests properly?
What makes you think your setup is capable of doing 100% accurate tests and that you are doing the tests properly?
Similar threads
- Replies
- 2
- Views
- 468
- Replies
- 10
- Views
- 740
- Replies
- 7
- Views
- 662
- Replies
- 88
- Views
- 6K
- Replies
- 5
- Views
- 1K