Here's some real data from my system:
I have only had it since early October last year, so hasn't had a full year cycle yet. But I still have some reasonable data.
I have tried to capture data from some perfect blue bird days throughout the last 8 months. This wasn't easy over the summer as I have an export limit of 5kW, so the other 10kW that are being generated during the middle of the day have to be used, and only a small amount could go into my battery.
Location: About 37.7 degrees South in New Zealand
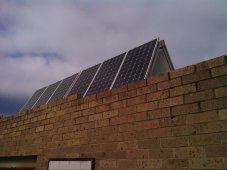
Roof pitch: 15degrees
Arrays: 6 in total, all equal size 2460W, 2 facing ENE, 2 facing WSW, and 2 facing NNE
Total production of ENE Arrays: 4251kWh
Total production of NNE Arrays: 4365kWh
Total production of WSW Arrays: 3825kWh
Edit: Ignore the cables lying on the roof etc, this photo was taken during installation.
 (1).jpg")
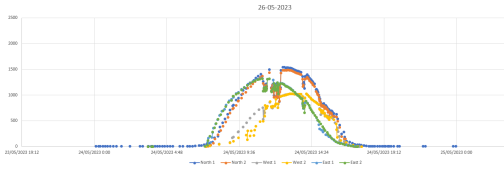
Mid-spring. You can see that one of the East facing strings gets going a bit earlier (the other one was shaded). But in the evening the North and west facing arrays are pretty much the same.

Mid-summer: This one had some cloud unfortunately, but there was very little difference between the arrays in the morning and evening. The North facing array just has a bit more total production.

Early Autumn - Like in spring, the east facing arrays definitely get going quite a bit earlier in the morning. The slightly south facing 'West' arrays have noticeably lower production in the middle of the day.

Same as above.

Late Autumn: still very similar, I don't have a good explanation for the strange kink in the late afternoon.