diy solar

diy solar

How non-linear is battery life?

wpns

Solar Joules are catch and release
Joined
Jul 6, 2023
Messages
1,043
Location
Turks & Caicos Islands
If a battery spec says:
"8000 cycles at 80% DOD at 0.5C"
Is there any way to guess how many cycles it'll do at 50% DOD or 0.25C, or elevated temperatures, or any combination thereof?
And yeah, I know that's 22 years, and I'll be lucky to be around then (yikes!), just curious how the lifetime varies depending on the various factors.

The most interesting metric is "dollars per KWHR", and the first few KWHR are going to be tens of thousands of dollars per KWHR, so knowing the expected lifetime helps get a better handle on it...

Thanks!
 
No way of really knowing.
What does 8,000 cycles mean exactly ?
Does it mean all cells fall over completely dead at 8,001 hours ?
Or does it mean that by the time you reach 8,000 hours half the cells have failed and needed to be replaced along the way, and 8,000 is the AVERAGE expected lifetime ?

I have thirty cells that have now been in constant solar service for 6.5 years.
Three cells failed dead short circuit over the first three years, one by one, almost like clockwork.
I was anticipating another failure at the four year mark, but it never happened.
No more cell failures after reaching the three year mark.
I am no statistician, but the first cell failed after probably only about 360 cycles.
The survivors are still going strong after at least 2,500 cycles.
What does it all mean ?
I have no idea.
 
These are 50Ahr Winston LiFePO4 cells.
All working perfectly, except one day I noticed all the individual cell voltages were a bit higher than usual, except for one cell that read zero.
And I mean zero, not one millivolt, or five millivolts, but zero millivolts.
The dead cell also had some slight swelling.
All three failures were sudden and instantaneous and total. Possibly from dendrite formation, I really do not know why.
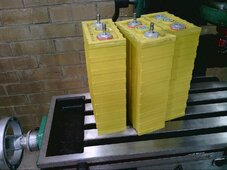
Three slightly bloated corpses:
 

Attachments

  • 2020-12-02_0002.jpg
    2020-12-02_0002.jpg
    277.4 KB · Views: 6
Last edited:
Cell cycle life in the manufacturers datasheet is typically specified from 0% to 100% at a certain C rate, until 80% of nameplate capacity remains. So after e.g. 4k cycles at 0.5C, the remaining capacity of the cell is 80% of what it used to be.

Now, while it is possible to increase cycle life by lowering the C rate, DoD, and in some cases put the eol at 70%, the main issues in real world solar conditions are 1) temperature and 2) calendar aging. Especially temperature: if you charge an LFP cell at 40+ degrees C, it will die very quickly. Keeping them at 25C is ideal.

I've got 32 cells that have been in constant use for 5 years, and another 32 that are now going into their third year. None have failed and I have not noticed any deterioration. How many cycles? Not sure, difficult to track. Temperature? Never over 30C, and even that was for very short amounts of time.

At current cell prices (getting another 32), I personally don't worry too much about the exact battery life, but keep them at 25C or thereabout to maximize. The other factors are rarely an issue in solar applications, and calendar aging is not something you can do much about (except storing cold when not in use).
 
If a battery spec says:
"8000 cycles at 80% DOD at 0.5C"
Is there any way to guess how many cycles it'll do at 50% DOD or 0.25C, or elevated temperatures, or any combination thereof?
And yeah, I know that's 22 years, and I'll be lucky to be around then (yikes!), just curious how the lifetime varies depending on the various factors.

The most interesting metric is "dollars per KWHR", and the first few KWHR are going to be tens of thousands of dollars per KWHR, so knowing the expected lifetime helps get a better handle on it...

Thanks!
I don’t think it’s possible to know at this point ..to many variables and different levels of quality out there…
there’s not enough time in the field to come up with valid long term averages based
on “ this or that or the other “ type use..

some day there will be I think…at least a close approximation, anyway….

It’s kinda like marriage … your just taking someone else’s word , and hoping for the best…

J.
 
I have not noticed any capacity degradation either over time.
I only have 5Kwh capacity which is quite small, and the cells do work reasonably hard, but are definitely not thrashed.
Charged to 3.45v and never discharged below 3.1v
Batteries are indoors, always at "comfortable human habitable temperatures" in a moderate climate

So working fine one day, stone dead the following day.
 
  • Like
Reactions: JRH
Did you have a BMS? It seems like the BMS should have shut it all down?
Not at that stage.
I had a good quality digital voltmeter monitoring total battery voltage, and this came with under and over voltage alarms which I used for battery disconnect. The relays in the voltmeter just triggered a shunt trip on the battery circuit breaker.

That was never triggered. With thirty cells, losing one cell does not change the total voltage, the other twenty nine all just take up the slack, and operate at a slightly higher voltage.

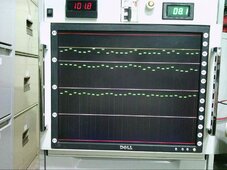
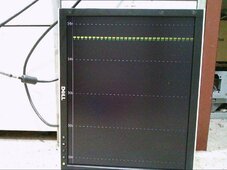
Since then, I now monitor all the individual cell voltages as a histogram on a video screen, but that is only for monitoring not control.
This was a very early (and crude) version of my video cell monitoring display.
It displays current cell voltage, plus peak max and min values reached on each cell.
The video part has been rebuilt and improved several times since then, but essentially still does the exact same thing.
 

Attachments

  • 2019-01-14_0001.jpg
    2019-01-14_0001.jpg
    315.1 KB · Views: 8
  • 2020-04-07_0002.jpg
    2020-04-07_0002.jpg
    269.9 KB · Views: 8
Last edited:
Nobody really knows for sure yet, as simulations of <.5C current cycles have to be done in real time. Above that it is literally a different chemical reaction in the cell.

The first cells I know that have been constantly gently cycled (3.0 - 3.45V) at maximum 0.5C were commissioned in 2007 and are still going at that rate.

From experience with EV, using higher C rates, we know that the cell internal resistance rises to a point where the high C rate is no longer attainable. This is non-linear, the IR rises rapidly near end of life.
 
How non-linear is battery life?
In answering the title of the thread, it would not be linear at all.

The modeling for something like battery decay is almost always an exponential function as they are typically a percent loss per unit time.
these formulas tend to be something like battery capacity=initial capacity-a*b^t.
The 80% benchmark may have some correspondence to the point where some battery chemistry in a lab where the rate of change (derivative) becomes very negative, very quickly.

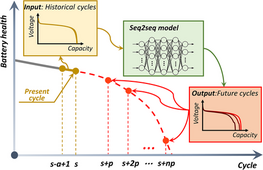
I did a quick search for the decay model and found this graph that represents the curve the formula above would create:
1000001563.png
(Image source: https://onlinelibrary.wiley.com/doi/full/10.1002/eom2.12213)
Sorry, I didn't read the paper. I just wanted a formula or curve.

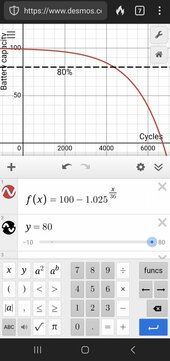
Here is another example of a formula that creates a curve that looks like this: (note this formula is not an actual model but the idea that gives the correct shape.)
1000001564.jpg
So it starts off with the initial battery capacity that decays, probably in an inverse proportion to the build up of something else.

All these models assume constant parameters, which is not reality. Changing C rates based off seasons, adding more batteries to the system (because none of us can stop), or even being more gental on a battery as it gets older will dramatically alter the model.

Sorry, I do math so I can't help myself. 🤪
 
That suggests only a gradual degradation model, heading downwards to an assumed end point, of no longer being of useful capacity.
But what about random sudden failure ?
 
I think its like buying a brand new car.
Could run faultlessly for years, or be a real lemon from day one.
Regardless of how well maintained, factory quality control probably comes into it as well.
Look at the issues with the eve LF280K series, three generations to try and fix its shortcomings.
 
In answering the title of the thread, it would not be linear at all.

The modeling for something like battery decay is almost always an exponential function as they are typically a percent loss per unit time.
these formulas tend to be something like battery capacity=initial capacity-a*b^t.
The 80% benchmark may have some correspondence to the point where some battery chemistry in a lab where the rate of change (derivative) becomes very negative, very quickly.

I did a quick search for the decay model and found this graph that represents the curve the formula above would create:
View attachment 208117
(Image source: https://onlinelibrary.wiley.com/doi/full/10.1002/eom2.12213)
Sorry, I didn't read the paper. I just wanted a formula or curve.

Here is another example of a formula that creates a curve that looks like this: (note this formula is not an actual model but the idea that gives the correct shape.)
View attachment 208122
So it starts off with the initial battery capacity that decays, probably in an inverse proportion to the build up of something else.

All these models assume constant parameters, which is not reality. Changing C rates based off seasons, adding more batteries to the system (because none of us can stop), or even being more gental on a battery as it gets older will dramatically alter the model.

Sorry, I do math so I can't help myself. 🤪
I can't find the chart but basically there's a fairly steep initial drop off in capacity over the first couple hundred cycles and then a slower steadier decline over the cycle count.
 
But what about random sudden failure ?

In the lab we've had very few random failures with cells. If they fail, they fail very early in their life time and tend to be manufacturing defects. Most, if not all of the other cases of premature failure are related to wrong charge parameters (especially overvoltage, keeping at higher voltages for long time, temperature, etc.).
 
Back
Top