diy solar

diy solar

Video showing grade A vs supposedly grade A, long but good.

Sam Cho TX

Solar Enthusiast
Joined
Jan 3, 2023
Messages
211
Location
Pensacola FL / Austin Tx
Just saw this video:

Some good information in this video, looks like for the most part even the alibaba cells are just fine despite having the scratched off QR code. But I have also read the forums with people that have had bad results. I think the only difference was that the alibaba cell was slightly bulged a bit, so maybe it failed because of cosmetic reasons only?
 
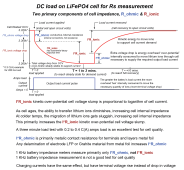
Not holding the load long enough to measure ionic migration overpotential drop. Need the cell terminal voltage slump after 1 to 3 minutes of load when cell voltage slump levels out at equilibrium for demanded cell current.

R_ohmic is a smaller part of cell total impedance. That is the 1 kHz battery tester 0.2 milliohm reading for a typical 280 AH cell. It is the R_ionic effective impedance that degrades the most with aging and it is much greater than R_ohmic.
Battery Impedance.png
 
Last edited:
One thing I find annoying with Andy's test is he tests different brands head to head. He already has grade B 280K would have been better test on grade A 280K vs grade B 280k, or grade A hithium vs grade B hithium.

Interesting results non the less.
 
At least Andy's testing did a long high current discharge showing true condition of cells.

His flaw in conclusion logic is comparing a supposedly grade A cell against an unknown condition grade B cell and concluding his good test result on an unknown condition grade B cell always means grade B cell are just as good as grade A cells.

Grade B might mean a cell is fine other than it doesn't quite make self leakage rate spec, or it is a used/abused cell that is pure crap.

When original QR code is ground out, you cannot even tell how old the cell is.
 
Last edited:
Yeah and then noobs will buy and get stuck with rando grade Bs getting upset. Its a gamble for sure.
 
Another comment about Andy's high discharge test that is important to note.

At the end of test he measured cell temp after the 200 amp high discharge current test and measured about 40 degs C at the surface. Inside core of cell will be 8-10 degs C hotter. At 200 amp discharge on a 280 AH cell there will be about 30-35 watts of cell internal heating. There is a lot of mass to the cell so heat will take some time to build up.

This shows the stress put on a cell when discharging above 0.5C discharge rate for long period of time.

This high temp gradient is more likely to create delamination of copper and aluminum foil from their respective graphite anode and LFP cathode electrode material.

Keep your sustained discharge current rate below 0.5 C(A).
 
One thing I find annoying with Andy's test is he tests different brands head to head. He already has grade B 280K would have been better test on grade A 280K vs grade B 280k, or grade A hithium vs grade B hithium.

Interesting results non the less.
Title of the videos says the point. My best cells (purportedly)versus my worst cells.
You want him to do best 280k versus worst 280k.
Tell HIM that. Maybe he'll do that test for you.
 
I am just initializing a customers set of LF280K cells. They were sourced from 18650 battery store as EV/Grade A. I purposely chose not to top balance just to see what happened. All cells were delivered with matching cell voltages out to the thousandths position (Fluke 289).

Out of the box voltage

#1 3.2959
#2 3.2958
#3 3.2957
#4 3.2959

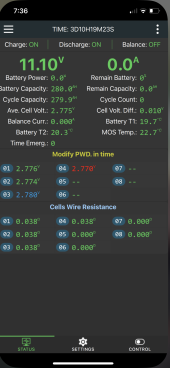
I connected them to to one of the 200A JK's we have in the shop. It struggled to keep them in balance once above 3.45. This is why matching cell voltages alone is NOT cell balancing.. .It took a few rounds of removing 5Ah then charging at 2A to finally get them in balance. A Parallel top balance would have been faster.

All that said, before the capacity test I charged them to 14.1V with a BK Precision 60A power supply. The JK and then began the discharge at 30A. I would have gone higher but my WMR 500W amplifier was giving me fits? Anyway, when charged to just 14.1V as a 4S pack with a 2.5V cut off the cells on discharge they delivered 279.9Ah. Not too bad but still not 280Ah.
I am not real happy with the JK BMS but it is certainly an improvement over the Daly & JBD's. So far the BMS I prefer is the REC... While the current EVE 280's certainly perform at rated capacity, there is no extra..... So far I am impressed with 18650 Battery Store. When I called them to order an extra set of busbars James could not have been nicer to deal with. I Like Dexter at CC but he told me they are moving away from DIY cells. This is why I sent the customer to 18650..... Seen too many crap cells through our shop from Ali.... etc... So far I am pretty happy with these cells and even after a 2.5V cut off the diff voltage is only 0.01V. I'm sure some will chime in and say "you did not charge to full 14.6V". BTDT many times & the difference between 14.1V and 14.6V is fractions of an Ah...

unnamed.png
 
Last edited:
I am just initializing a customers set of LF280K cells. They were sourced from 18650 battery store. I purposely chose not to top balance just to see what happened. All cells were delivered with matching cell voltages out to the thousandths position (Fluke 289). I connected them to tone of the 200A JK's we have in the shop. It struggled to keep them in balance once above 3.45. This is why matching cell voltages is NOT cell balancing...It took a few rounds of removing 5Ah then charging at 2A to finally get them in balance. A Parallel top balance would have been faster.
All that said, before the capacity test I charged them to 14.1V with the JK and then began the discharge at 30A. I would have gone higher but my WMR 500W amplifier was giving me fits? Anyway when charged to just 14.1V as a 4S pack with a 2.5V cut off the cells delivered 279.9Ah. Not too bad but still not 280Ah.
View attachment 142054
Everyone here will tell you that matching cell voltage below the knee does not indicate balanced cells.
 
the difference between 14.1V and 14.6V is fractions of an Ah
Absolutely true. Perhaps 0.1 amp hour.
I think you got what you bought.
When we buy a replacement battery for our cars do we capacity test them and squawk at pep boys that they only test at 669 cold cranking amps instead of 670?
 
Everyone here will tell you that matching cell voltage below the knee does not indicate balanced cells.
Yes, I've known that since 2009... Still does not stop many from repeating the same rubbish about matching voltages with a resistor etc...
 
Yes, I've known that since 2009... Still does not stop many from repeating the same rubbish about matching voltages with a resistor etc...
And yet, you repeated it as if it was meaningful out to the fourth decimal place with your fluke.
 
It is hard to get better than 0.5% matching on cells. Manufacturing tolerance in electrode printing thickness causes capacity variation. There is a rough adjustment by measuring final baked electrode thickness and adjusting number of wrap layers to compensate for electrode layer thickness. Both positive LFP and negative graphite electrode thicknesses must be ratio matched and taken into account for wrap layer compensation during manufacturing.

Same rested open circuit cell voltage means they are at similar SoC for their given capacity. When you fully charge the series connected cells they are all getting the same current vs. time so the cells with slightly greater capacity will lag behind slightly less capacity cells until they balance out to 100% state of charge on all cells.

You usually want top balance to avoid cell overvoltage issues when fully charging. The more mismatched the cells, the tougher it is to keep them in balance.

True matching includes close overpotential voltage slump versus cell current and similar self-discharge rate, not just capacity of cells. Too much wrap layer compensation causes deviations in these other parameters even though net cell capacity is similar. Automotive cell specs often put requirements on matching these other parameters which also increases their manufacturing costs.

Ambient temperature variation between cells in a battery series stack will cause 'matched' cells to be mismatched. BMS should not be mounted to side of end cell due to BMS heating transfer to end cell. For EV's with 300-500 vdc of series stacked cells it is tough to keep uniform temperature across all cells. Tesla did a smart thing with glycol heat distribution system. Nissan Leaf had premature battery degradation for not controlling pack temperature uniformity.
 
Last edited:
And yet, you repeated it as if it was meaningful out to the fourth decimal place with your fluke.
Simply to point out that matching cell voltages does not meant the cells are balanced. keep in mind I come from the days of LFP when cell volt matching was gospe…
 
Last edited:
Not holding the load long enough to measure ionic migration overpotential drop. Need the cell terminal voltage slump after 1 to 3 minutes of load when cell voltage slump levels out at equilibrium for demanded cell current.

R_ohmic is a smaller part of cell total impedance. That is the 1 kHz battery tester 0.2 milliohm reading. It is the R_ionic effective impedance that degrades the most with aging and it is much greater than R_ohmic.
View attachment 139831
This is far too advanced for me. Is there a simpler term to explain this? And how to determine if the cell is Grade A or Grade B based on the voltage drop resulted by these R_ionic and R_ohmic values.(or preferably how to distinguish between a new cell and a used cell.).
 
This is far too advanced for me. Is there a simpler term to explain this? And how to determine if the cell is Grade A or Grade B based on the voltage drop resulted by these R_ionic and R_ohmic values.(or preferably how to distinguish between a new cell and a used cell.).
Grade 'A' or 'B' means whatever the vendor wants it to mean.

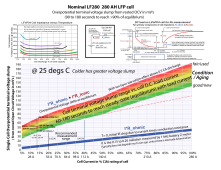
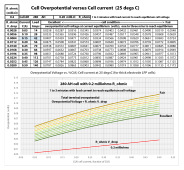
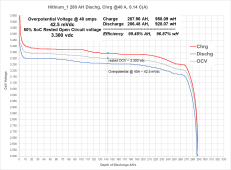
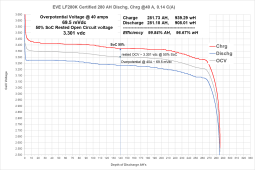
Overpotential voltage slump under load current from rested unloaded open circuit voltage is good indicator of cell condition. Overpotential voltage slump increases with usage. There can also be manufacturing defects that are put in the 'sell to aftermarket' pile.

Attached is Andy's data at 40 amps of discharge followed by full recharge so I could estimate overpotential of cells. The colored dots on lower left of chart are the various cells he measured. The 'Certified' EVE LF280k cell was the worst for overpotential voltage slump. All cells made AH rating.

He did not take the temperature when making each test which can affect results. Below 15 degs C increases overpotential slump with current and reduces extractable capacity.

LF280 overpotiential curve 2.png
Cell Overpotential Chart.png
The best.
1686344759746.png
The worst.
1686344816792.png

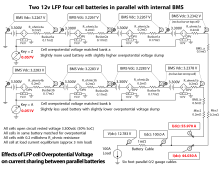
This is an example of parallel batteries, 4s, where cells are perfectly matched in each battery but the two batteries have slightly different overpotential voltage slump. Everything else is identical. The resultant battery current sharing balance is shown in red.
Batteries in parallel matching.png
 
Andy does his measurements with... well this ghetto buss bar with clamp method... Do you think this has an affect on the readings?
 
Back
Top