ksmithaz1
Solar / EV Junkie
I consistently pull full output from my strings. Of course, I optimize array angle for the sun horizon per season, no shade. I also see by 9 AM about 1/3 of my array power coming in during winter season if there is sun.
Of course, I have to ask, what panels, series and parallel strings, any shade, panel angle and quite a few other questions.
I'm pulling 40Kwh easily off 8420W of panels when the sun is out here in late fall/early winter but skies are clear with no dust or haze helps. Only days I run my furnace is when 2 or more days of no sun is in the forecast. I only charged the battery bank 8.5Kwh yesterday and 2.9Kwh today. On November 30th, I not only supplied 28.8Kwh for loads, I also charged the bank 18Kwh. November 29th was 21.7Kwh load and battery 27.2Kwh.
455's are on the roof, fairly optimal, maybe 5 degrees too flat, due south.
Targets:
8*455 = 3640
8*250 = 2000
7*250 = 1750
32*455 = 14560
8*15 = 3750 (Used, sub-optimal orientation)
T = 18310
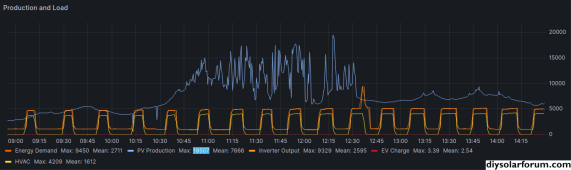
On 8/27, it was bright, clear and sunny all day . . . You see A|B-PV1|2 should be able to hit 3640. I do see strange spikes from time to time, discussion below

I see radical spikes, on cloudy days, I think it's due to a capacitive state in the panels while the MPPT ramps up/down. I'm guessing that since the demand was there, this allows a more immediate discharge, The spikey numbers occur as the clouds light the panels back up. So while I've seen numbers that exceed theoretical max (see below) it only happens when I'm getting volatile readings, which are extremely short lived
On 8/14 we had a lot of broken monsoon clouds

And overall production on those days is comparably poor.

I'd be willing to bet if I was overpaneled on the 14th I would have seen a pretty linear benefit from the extra panels, despite the supposed high output numbers. Using an average peak of 3000 from the 27th, a very good day. (Which I actually think is probably high).
100 - ( 3000/3650 * 100)
17.8100
I could over-panel around 20% to generally hit the theoretical spec on a perfect day, and rarely even clip, if at all. That gets back to the 95th percentile stuff. Over the period where ideal production can hit 50% (?) or better what is the sample at the 95th percentile? Is that low enough? Unless you have your panels on a tracker and/or highly optimized, I'm guessing around 25% in a normally sunny environment would create a mostly linear improvement in output. I think the spikes I see in output would mostly just flatten if the MPPT didn't take the current. I think the loss from clipping would be minimal. The larger the percentage of time below whatever threshold you pick the more linear the benefit.
I could be full of it, but in my world, I just don't see it. I'd love someone to show me a graph that shows their panels hitting 100% of rated output for more than a 5 minute interval. Neither do I think the vast majority of panels are 100% optimally facing all the time, but you can only flatten that solar curve so much.
When I have a bit more data after this summer, I plan on doing some percentile calculations.

/cloudfront-us-east-2.images.arcpublishing.com/reuters/X4WGVSEFN5NGRJNS36KUROE5KM.jpg)