Tulex
Solar Wizard
Where are you downloading it from?What do you mean only PV?
It is an excel file with all 56 or so parameters for the whole day.


Where are you downloading it from?What do you mean only PV?
It is an excel file with all 56 or so parameters for the whole day.
In PowerviewWhere are you downloading it from?
When you go into PowerView and go back a few days do you see a power graph?I have no "Operations Data"
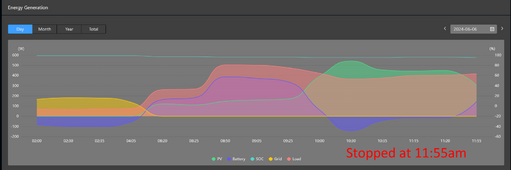
I go to my plant, scroll down, I see the chart under Energy Generation. I can back arrow the date to see a graph that has 5 different items showing. But there is nothing there to click to download. The only place I have a download button is on the plant list page.When you go into PowerView and go back a few days do you see a power graph?
If so pick that day for the download.
What browser are you using?I go to my plant, scroll down, I see the chart under Energy Generation. I can back arrow the date to see a graph that has 5 different items showing. But there is nothing there to click to download. The only place I have a download button is on the plant list page.
I go to my plant, scroll down, I see the chart under Energy Generation. I can back arrow the date to see a graph that has 5 different items showing. But there is nothing there to click to download. The only place I have a download button is on the plant list page.

Firefox:Using chrome, yeah, I don't have that. Just my plants, equipment, intelligent. Same thing with Edge.

Same thing for me using MySolark. I wonder why your powerview is missing those two options?It does show in Mysolark, replaces intelligent. Doesn't show for powerview in firefox either.
The RJ45 splitter sold by Solarassistant works on the 15kw. It separates the CAN and RS485. It costs like $12. It separates the CAN on pin 4-5 and RS485 on pin 1-3. I tried some other amazon options, considered building my own, but it just works. I was having trouble with amazon options. I'm using on 15k and SOK battery rack on closed communication.When you are in closed communication mode some of the battery voltage settings come from the battery and may be blocked. As others have said, Solar Assistant and the screen lets you change many others. I am not sure how you even connect via the RS232 port if that is the same one that is used by your battery? The 15k may be different than the 12k in the labeling of those ports.


The thing with Amazon options, which is where I got mine, is to make sure it's a simple splitter and not an ethernet splitter.The RJ45 splitter sold by Solarassistant works on the 15kw. It separates the CAN and RS485. It costs like $12. It separates the CAN on pin 4-5 and RS485 on pin 1-3. I tried some other amazon options, considered building my own, but it just works. I was having trouble with amazon options. I'm using on 15k and SOK battery rack on closed communication.
Difference is, SA pulls data constantly locally. Solark app has to pull the data then report it. SA is seconds, Solark can be minutes, or hours depending how often it grabs data. Lately, Mysolark is going offline constantly, I have hour gaps between reporting. Any data for the last 3 months might be off as that's how long they've been interrupting data flow for the switch over.Anyone have any thoughts as to how it's even possible to have numbers this skewed?
Here are screenshots of Solar Assistant vs MySolArk:
Solar Assistant:
View attachment 220340
MySolArk:
View attachment 220341
Don't both Solar Assistant and MySolArk basically just "read" data from the inverters? Solar Assistant might track, record and calculate totals internally. But the inverters obviously do the same, so how can MySolArk have these crazy off numbers. And by crazy off numbers, I am referring to how there doesn't seem to be any rhyme or reason as to where the numbers are at. For instance battery charge is nearly identical in my screenshots. Loads are close but MySolArk is about ~4% lower than SA, but then PV is ~44% lower....
Yes, but @robby says:Difference is, SA pulls data constantly locally. Solark app has to pull the data then report it. SA is seconds, Solark can be minutes, or hours depending how often it grabs data. Lately, Mysolark is going offline constantly, I have hour gaps between reporting. Any data for the last 3 months might be off as that's how long they've been interrupting data flow for the switch over.
If that is how it works, then there should be no "lost" data.The Inverter stores 18 hours of Data. So if the connection is lost it will wait until it's back and then dump the data to the server.
If you go past 18 hours without a connection then FIFO is applied.