diy solar

diy solar

The new "My Sol-Ark" App and Migration to AWS is happening very soon.

My system is displaying. The dashboard generation numbers for today are off. However the numbers for today are correct if I go into equipment/overview.

I'm seeing something similar. Looking at numbers from "overview" the numbers seem low on several paramters, but in particular the PV generation for the day (showing about 14 kWh so far, should be about 20):
1717871509934.png

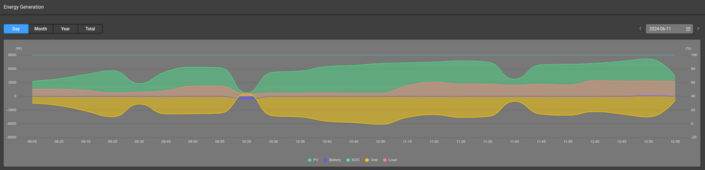
When I go into "equipment" however, the numbers seem to match what my Tigo monitor is telling me on generation (correctly showing about 20 kWh PV so far today):
1717871586345.png

Interestingly, under equipment 'my sol-ark' is showing my solark 12k twice, with one of them being offline and not having any data. Not sure whats up with that...

1717871713742.png
 

Attachments

  • 1717871566383.png
    1717871566383.png
    206.1 KB · Views: 0
The Dongle IP has been changed so that the data goes to AWS.
Nothing is going to China or is routed through China.
Most customers are back up and running but they are still having issues with a percentage of accounts.
 
The Dongle IP has been changed so that the data goes to AWS.
Nothing is going to China or is routed through China.
Most customers are back up and running but they are still having issues with a percentage of accounts.
That would be me too I guess, the gateway dongle has been offline since the 24th... As an update though I had a couple nice chats with support today, since my dongle/gateway has been off-line, and we tried to at least get the dongle to show its local Wi-Fi Name, EAPxxxx, but it doesn't appear anymore at all and the gateway shows zero signal. Although the red and green leds are normal, they're sending me a new dongle just in case (my S.W.A.G).
 
Last edited:
There's still something wrong.
I can view the graphs one time and all the data is there.
Then I come back 15 minutes later and the graphs have no data.
They were updating at a 20 minute rate.
Now the graphs show 10 minute updates when they are working
 
There's still something wrong.
I can view the graphs one time and all the data is there.
Then I come back 15 minutes later and the graphs have no data.
They were updating at a 20 minute rate.
Now the graphs show 10 minute updates when they are working
Right now mine is still going at 5 minute intervals.
Two possible problem. This was never going to go 100% smoothly so it's possible that they had to stop the servers a few times to do some changes. The second possibility is that your dongle is having an issue and not sending the Data to their servers on a regular 5min interval.
 
I am also seeing some sites show PV production numbers in the morning long before the sun has been out enough to do much. But that is hit or miss from one system to another. Some are showing zero PV before the sun has been out, others show as much as 43kWh...

I'm a little baffled at the lack of things matching up across the board... I considered starting a case with Sol-Ark, but I'm suspicious there may not even be a response for a few days. I have had that happen before, and I wouldn't be surprised if their tech support is getting a pretty large amount of people asking "why can't I see my system data in PV Pro?"
 
There's still something wrong.
I can view the graphs one time and all the data is there.
Then I come back 15 minutes later and the graphs have no data.
They were updating at a 20 minute rate.
Now the graphs show 10 minute updates when they are working
Same here, my graphs are all over the place. Sometimes 5 minute reporting intervals, sometimes 20, sometimes 2 hours.
 
Can one check this anywhere OR do you have to be on your home WiFi to do so? 🤔
You can check it from anywhere that you have internet access. That is of course assuming your home WiFi is connected to the Internet and is not a closed system.
 
Same here, my graphs are all over the place. Sometimes 5 minute reporting intervals, sometimes 20, sometimes 2 hours.
Exactly the same here. It was consistently uploading every 5 minutes right up to the point that data disappears from PV Pro. Starting in the new "My Solark" / "Solark Cloud" or whatever it's called, it has been super inconsistent. First spot check and I see intervals of 5 minutes, 25 minutes, 1 hour 15 minutes, 1 hour 50 minutes. Funniest thing is that they're equally spaced in the graph, so the graph looks like trash.
 
Exactly the same here. It was consistently uploading every 5 minutes right up to the point that data disappears from PV Pro. Starting in the new "My Solark" / "Solark Cloud" or whatever it's called, it has been super inconsistent. First spot check and I see intervals of 5 minutes, 25 minutes, 1 hour 15 minutes, 1 hour 50 minutes. Funniest thing is that they're equally spaced in the graph, so the graph looks like trash.
Can you post a screen shot that I can forward to them.
 
Mine seems to have all the 5 minute data since it cutover ~5 days ago, and got the historical data ~2 days ago.
 
Mine seems to have all the 5 minute data since it cutover ~5 days ago, and got the historical data ~2 days ago.
My data since the switch is fine but I have not gotten back my daily historical data.
One annoying thing is that under Safari browser the webpage is very hard to navigate. The Vertical scrolling jumps up and down with the slightest screen touch.
 
Just some information for other people. I had my system deployed by a 3rd party. When that was done I was not listed on the account so when the roll over happened I lost access to my remote monitoring when my inverter was rolled over from pv pro.

I called in and they fixed the issue and was up and running. My historical data followed soon after.
 
No, sorry, I don't use Solar Assistant.

But here's the entire PV part of the JSON response from the website's /api/v1/plant/energy/*/day endpoint, which shows all of the collected datapoints. The other labels contain the same time datapoints. Also, the last update was many, many hours ago, so clearly something is still broken.

JSON:
{
  "code": 0,
  "msg": "Success",
  "data": {
    "infos": [
      {
        "unit": "W",
        "records": [
          {
            "time": "08:05",
            "value": "3290.0",
            "updateTime": null
          },
          {
            "time": "08:20",
            "value": "3840.0",
            "updateTime": null
          },
          {
            "time": "09:10",
            "value": "4781.0",
            "updateTime": null
          },
          {
            "time": "09:25",
            "value": "5593.0",
            "updateTime": null
          },
          {
            "time": "09:30",
            "value": "2823.0",
            "updateTime": null
          },
          {
            "time": "09:45",
            "value": "5409.0",
            "updateTime": null
          },
          {
            "time": "09:50",
            "value": "6366.0",
            "updateTime": null
          },
          {
            "time": "09:55",
            "value": "6265.0",
            "updateTime": null
          },
          {
            "time": "10:25",
            "value": "766.0",
            "updateTime": null
          },
          {
            "time": "10:30",
            "value": "5284.0",
            "updateTime": null
          },
          {
            "time": "10:35",
            "value": "5522.0",
            "updateTime": null
          },
          {
            "time": "10:40",
            "value": "6536.0",
            "updateTime": null
          },
          {
            "time": "10:45",
            "value": "6775.0",
            "updateTime": null
          },
          {
            "time": "10:50",
            "value": "7195.0",
            "updateTime": null
          },
          {
            "time": "11:15",
            "value": "7342.0",
            "updateTime": null
          },
          {
            "time": "11:20",
            "value": "7514.0",
            "updateTime": null
          },
          {
            "time": "11:25",
            "value": "7771.0",
            "updateTime": null
          },
          {
            "time": "11:30",
            "value": "7497.0",
            "updateTime": null
          },
          {
            "time": "11:40",
            "value": "3765.0",
            "updateTime": null
          },
          {
            "time": "11:45",
            "value": "6923.0",
            "updateTime": null
          },
          {
            "time": "11:50",
            "value": "7015.0",
            "updateTime": null
          },
          {
            "time": "12:40",
            "value": "7200.0",
            "updateTime": null
          },
          {
            "time": "12:45",
            "value": "7667.0",
            "updateTime": null
          },
          {
            "time": "12:50",
            "value": "8188.0",
            "updateTime": null
          },
          {
            "time": "12:55",
            "value": "4349.0",
            "updateTime": null
          }
        ],
        "id": null,
        "label": "PV",
        "groupCode": null,
        "name": null
      },
      // ...
    ]
  },
  "success": true
}
 
Call them and have them fix it.
I think you have waited more than enough time. I have SA so it’s not that big a deal but your soley depending on this to provide data.
 

diy solar

diy solar
Back
Top