diy solar

diy solar

Internal Resistance 280ah cells important questions

elvis_asaftei

New Member
Joined
Jul 5, 2021
Messages
257
Hi,

I received batteries from different China factories to EU and it seems that they vary a lot.

Checked them at 28C environmental temperature.

one factory that have 6000 cycles has 0.20 mOhms internal resistance of each cell (very well balanced +/- 0.01 mOhms) at 3.29V.

another factory with 4000 cycles (80% DOD) that is a copy of CATL that advertise the cells to be 310ah or 320ah has internal resistance of 48 cells checked between 0.26mOhms and 0.31 mOhms at 3.29V and have a swollen middle of prismatic cells.

What i want to know is what exactly internal resistance cal tell us at the same temperature.

Is it related to capacity or more to ability to sustain a load test ?

Please let me know what do you think. Thank you.
 
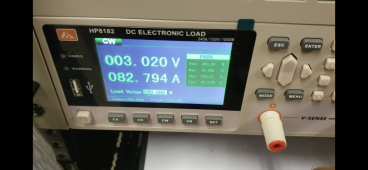
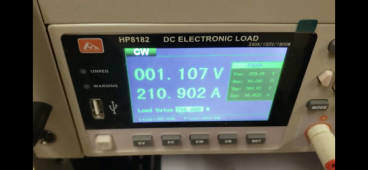
for example i can show you 2 tests of 2 separate batteries of 280ah that show the same internal resistance and same voltage under no load.

But when doing a 0.2C load test of 250Watt we can see this :

good battery voltage at constant power is above 3 volts :
8334CB8C-4F9A-489A-A382-0E0C46C16FDE.png


but bad battery voltage drops to 1Volt, even if both voltage and internal resistance were at the same values before the load test :
23BF1B17-6494-42B7-9BAE-8706973352F2.png
 
Clarification please:
1) Are these being tested just out of the shipping box ?
2) Have you Top Charged the cells prior to testing.
NB) Cells are shipped at nominal voltage of 3.200 because it is ideal for storage. Reading IR at this state means little. SADLY many vendors in China call their cells Matched because they Voltage & IR test with a YR1035+ or similar at their static storage voltage, which is fairly useless.

Top Charge: Similar to top balancing cells in parallel. Charge to 3.650 and allow the cells to take charge to 0.05C (at minimum) but I let CV continue till the cells take <2A. Then allow to settle 24-36 hours and re-top, allow to settle 2 hours and test ? You would have to do this before running a cell capacity test.

Properly Matched & Batched cells go through a full charge to discharge cycle 3 times. Measurements are taken through the Discharge & Charge cycle at various C Rates and logged. Upon completion cells that match IR & Impedances across their operational voltages are then batched together. This is a time-consuming costly process that can add up to 50% above the cost "Bulk Commodity Cells" which many vendors sell as Voltage & IR Matched.

BE AWARE that using Bulk Commodity cells in parallel can result in various problems and issues. They will often have "runners" which will either reach 3.650Vpc well ahead of the others or reach 2.500 before the others. Bulk cells can deviate by as much as 1mv per AH of capacity which can also trigger a Cell Difference cutoff. So a 300AH cell can deviate as much as 300mv, this is NOT good. The higher the Amperage is (Charge or Discharge) the faster & greater the deviation. ALSO, with Bulk Cells it is more noticeable, when a Large Load surge hits the battery pack, the cells will take a sag of course BUT you will see the lower IR cells will sag deeper & take longer to recover. There is a BMS GOTCHA there ! All BMS' have a CUTOFF DELAY TIME (or similarly worded) which can be increased slightly to allow for hard dips & recovery time, I have found that 10 seconds is sufficient... This was all discovered during my Thrash Test cycle which was Hard Reliability & Performance testing of the entire system including some "controlled abuse"

Once packs are assembled and ready to go after a proper Top Balancing, you can run them as normal.
Do not be aggressive with charging and keep a respectable charge profile. Be aware that above 3.500 and below 2.875 only represents about 5% of the actual energy stored. The working Voltage is 3.000-3.400 with the nominal being 3.200.

Here is my Solar Controller charge profile, this will reduce the amount of HVD's by preventing runners from getting carried away. The Float being CV allows all the cells to top off & balance quite comfortable without stress
All equipment MUST BE Voltage Corrected & Calibrated (VERY IMPORTANT) see link in my signature on how to do it.
Divide Values X2 for 12V. Multiply X2 for 48V.
Absorb: 28.2 for 15 minutes (3.525vpc) (some call this boost)
Equalize: OFF
Float 27.9V (3.4875vpc)
MIn Volts: 22.0 (2.750vpc)
Max Volts: 28.7 (3.5875vpc)
Rebulk Voltage: 27.7 (3.4625vpc)
End Amps: 14A (*1)

(*1): End Amps is calculated from the Highest AH Battery Pack in a Bank. IE: 200AH X 0.05 = 10A 280AH X 0.05 = 14A.
NB: Victron Forum discussion says EndAmps = TailCurrent
This get's the bank charged to full with high amps (Constant Current) and then float (Constant Voltage) tops off so the cells are on average between 3.475-3.500. I am running 7/24/365 so float is used up by the Inverter + provides whatever the packs will take to top off.

** Coulumbic Efficiency for LFP is 99%

Now a piece of Sad News:
Matched Grade-A cells always test out higher than the rating. EVE Matched 280's for example always come in between 288-295AH, the same cells but bulk always come in between 275-282AH barely and their IR can be anywhere from 016-022 or farther. Essentially you will get Full AH from Matched but take 10-15% off the Bulk Cell AH Rating for Real World actual AH. So a 280 Bulk will give you 250AH reliably/consistently but above that - "maybe/possibly".

NOTE: LFP (LiFePO4) is LFP BUT every company is slightly different with their own chemistry blends and tweaks, this is generally no problem whatsoever (it's just chemistry differences internal only). As a result of the various chemistries & Grades the specifications can vary between companies. Some are more tolerant to cold temps than others (Yttrium doped) but still the same general characteristics. ALWAYS Defer to the Spec Sheet for the Specific Make & Model of cells you have, there are subtle differences.

Hope it helps, Good Luck.
 
Internal resistance tells you one thing and one thing only: the internal resistance of the cell.

If it’s outside the data sheet specification it may be one clue as to cell fitness, but beyond that it really doesn’t provide further insight.

As far as whether it relates to capacity or load test:

It is loosely correlated to capacity. A lower capacity cell will generally have a higher internal resistance. A cell designed for 200A charge/discharge is likely going to have a larger capacity and lower IR than a cell designed for 10A charge/discharge, and most cells, regardless of size, range between 1C and 3C maximum charge/discharge. Note that new designs are lowering IR for small cells, such as Tesla’s latest battery design.

IR directly impacts load testing. It represents the energy lost to heat during charging/discharging.

In general don’t read too much into internal resistance. It means what it says, and doesn’t hold any secrets beyond that.
 
Clarification please:
1) Are these being tested just out of the shipping box ?
2) Have you Top Charged the cells prior to testing.
NB) Cells are shipped at nominal voltage of 3.200 because it is ideal for storage. Reading IR at this state means little. SADLY many vendors in China call their cells Matched because they Voltage & IR test with a YR1035+ or similar at their static storage voltage, which is fairly useless.

Top Charge: Similar to top balancing cells in parallel. Charge to 3.650 and allow the cells to take charge to 0.05C (at minimum) but I let CV continue till the cells take <2A. Then allow to settle 24-36 hours and re-top, allow to settle 2 hours and test ? You would have to do this before running a cell capacity test.

Properly Matched & Batched cells go through a full charge to discharge cycle 3 times. Measurements are taken through the Discharge & Charge cycle at various C Rates and logged. Upon completion cells that match IR & Impedances across their operational voltages are then batched together. This is a time-consuming costly process that can add up to 50% above the cost "Bulk Commodity Cells" which many vendors sell as Voltage & IR Matched.

BE AWARE that using Bulk Commodity cells in parallel can result in various problems and issues. They will often have "runners" which will either reach 3.650Vpc well ahead of the others or reach 2.500 before the others. Bulk cells can deviate by as much as 1mv per AH of capacity which can also trigger a Cell Difference cutoff. So a 300AH cell can deviate as much as 300mv, this is NOT good. The higher the Amperage is (Charge or Discharge) the faster & greater the deviation. ALSO, with Bulk Cells it is more noticeable, when a Large Load surge hits the battery pack, the cells will take a sag of course BUT you will see the lower IR cells will sag deeper & take longer to recover. There is a BMS GOTCHA there ! All BMS' have a CUTOFF DELAY TIME (or similarly worded) which can be increased slightly to allow for hard dips & recovery time, I have found that 10 seconds is sufficient... This was all discovered during my Thrash Test cycle which was Hard Reliability & Performance testing of the entire system including some "controlled abuse"

Once packs are assembled and ready to go after a proper Top Balancing, you can run them as normal.
Do not be aggressive with charging and keep a respectable charge profile. Be aware that above 3.500 and below 2.875 only represents about 5% of the actual energy stored. The working Voltage is 3.000-3.400 with the nominal being 3.200.

Here is my Solar Controller charge profile, this will reduce the amount of HVD's by preventing runners from getting carried away. The Float being CV allows all the cells to top off & balance quite comfortable without stress


Now a piece of Sad News:
Matched Grade-A cells always test out higher than the rating. EVE Matched 280's for example always come in between 288-295AH, the same cells but bulk always come in between 275-282AH barely and their IR can be anywhere from 016-022 or farther. Essentially you will get Full AH from Matched but take 10-15% off the Bulk Cell AH Rating for Real World actual AH. So a 280 Bulk will give you 250AH reliably/consistently but above that - "maybe/possibly".

NOTE: LFP (LiFePO4) is LFP BUT every company is slightly different with their own chemistry blends and tweaks, this is generally no problem whatsoever (it's just chemistry differences internal only). As a result of the various chemistries & Grades the specifications can vary between companies. Some are more tolerant to cold temps than others (Yttrium doped) but still the same general characteristics. ALWAYS Defer to the Spec Sheet for the Specific Make & Model of cells you have, there are subtle differences.

Hope it helps, Good Luck.


Thank you for the answer.

1) All cells are 3.296V and arrived with this voltage, this means 70% state of charge when tested
2) No, but what is the difference between 70% and 99% charge amount when being tested for 3 seconds ?
 
Clarification please:
1) Are these being tested just out of the shipping box ?
2) Have you Top Charged the cells prior to testing.
NB) Cells are shipped at nominal voltage of 3.200 because it is ideal for storage. Reading IR at this state means little. SADLY many vendors in China call their cells Matched because they Voltage & IR test with a YR1035+ or similar at their static storage voltage, which is fairly useless.

Top Charge: Similar to top balancing cells in parallel. Charge to 3.650 and allow the cells to take charge to 0.05C (at minimum) but I let CV continue till the cells take <2A. Then allow to settle 24-36 hours and re-top, allow to settle 2 hours and test ? You would have to do this before running a cell capacity test.

Properly Matched & Batched cells go through a full charge to discharge cycle 3 times. Measurements are taken through the Discharge & Charge cycle at various C Rates and logged. Upon completion cells that match IR & Impedances across their operational voltages are then batched together. This is a time-consuming costly process that can add up to 50% above the cost "Bulk Commodity Cells" which many vendors sell as Voltage & IR Matched.

BE AWARE that using Bulk Commodity cells in parallel can result in various problems and issues. They will often have "runners" which will either reach 3.650Vpc well ahead of the others or reach 2.500 before the others. Bulk cells can deviate by as much as 1mv per AH of capacity which can also trigger a Cell Difference cutoff. So a 300AH cell can deviate as much as 300mv, this is NOT good. The higher the Amperage is (Charge or Discharge) the faster & greater the deviation. ALSO, with Bulk Cells it is more noticeable, when a Large Load surge hits the battery pack, the cells will take a sag of course BUT you will see the lower IR cells will sag deeper & take longer to recover. There is a BMS GOTCHA there ! All BMS' have a CUTOFF DELAY TIME (or similarly worded) which can be increased slightly to allow for hard dips & recovery time, I have found that 10 seconds is sufficient... This was all discovered during my Thrash Test cycle which was Hard Reliability & Performance testing of the entire system including some "controlled abuse"

Once packs are assembled and ready to go after a proper Top Balancing, you can run them as normal.
Do not be aggressive with charging and keep a respectable charge profile. Be aware that above 3.500 and below 2.875 only represents about 5% of the actual energy stored. The working Voltage is 3.000-3.400 with the nominal being 3.200.

Here is my Solar Controller charge profile, this will reduce the amount of HVD's by preventing runners from getting carried away. The Float being CV allows all the cells to top off & balance quite comfortable without stress


Now a piece of Sad News:
Matched Grade-A cells always test out higher than the rating. EVE Matched 280's for example always come in between 288-295AH, the same cells but bulk always come in between 275-282AH barely and their IR can be anywhere from 016-022 or farther. Essentially you will get Full AH from Matched but take 10-15% off the Bulk Cell AH Rating for Real World actual AH. So a 280 Bulk will give you 250AH reliably/consistently but above that - "maybe/possibly".

NOTE: LFP (LiFePO4) is LFP BUT every company is slightly different with their own chemistry blends and tweaks, this is generally no problem whatsoever (it's just chemistry differences internal only). As a result of the various chemistries & Grades the specifications can vary between companies. Some are more tolerant to cold temps than others (Yttrium doped) but still the same general characteristics. ALWAYS Defer to the Spec Sheet for the Specific Make & Model of cells you have, there are subtle differences.

Hope it helps, Good Luck.


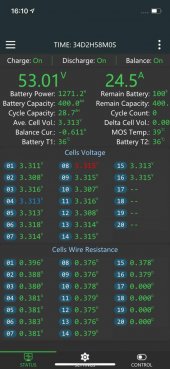
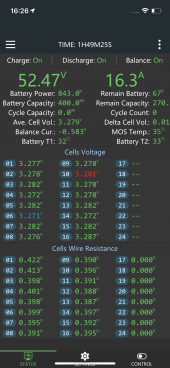
What i use are cells really well matched (see that it is 0.00V difference , and use JK Active BMS :


WhatsApp Image 2021-07-07 at 14.37.17.jpeg
 

Attachments

  • WhatsApp Image 2021-07-07 at 14.37.17.jpeg
    WhatsApp Image 2021-07-07 at 14.37.17.jpeg
    63.2 KB · Views: 3
Internal resistance tells you one thing and one thing only: the internal resistance of the cell.

If it’s outside the data sheet specification it may be one clue as to cell fitness, but beyond that it really doesn’t provide further insight.

As far as whether it relates to capacity or load test:

It is loosely correlated to capacity. A lower capacity cell will generally have a higher internal resistance. A cell designed for 200A charge/discharge is likely going to have a larger capacity and lower IR than a cell designed for 10A charge/discharge, and most cells, regardless of size, range between 1C and 3C maximum charge/discharge. Note that new designs are lowering IR for small cells, such as Tesla’s latest battery design.

IR directly impacts load testing. It represents the energy lost to heat during charging/discharging.

In general don’t read too much into internal resistance. It means what it says, and doesn’t hold any secrets beyond that.

Any other clues about how to find good and bad cells ?

Knowing the impedance of the battery allow one to determine 1) maximum charging and/or discharging current simple math ( in Amps ) I = V/2R
As an example: using a 12V battery , if the measured resistance is 0.10 ohms then Max current capable of being drawn out of this battery = 12 /0.2 = 60 A
for how long is depended on A/H of the battery .
In my humble opinion a resistance measurement is far more valuable than V or A/H , you can have a 120V 100 A/H Battery which technically has 12,000W/H ,
but if it internal resistance is 10 ohm you can only take out a measly 720 peak watt ( about a 1 HP) , now take the same battery with 0.05 ohm resistance will allow you 144,000 peak watts or close to 200 HP.
In summary, resistance is the MOST IMPORTANT PARAMETER in a battery to know , will dictate how fast you can discharge and/or charge it ..
 
I suspect much is lost in the translation.
I haven't the energy to get into a long cross exchange with tanslation muddling into it at this time.
 
I see, so why 70% charge voltage is identical to all cells is meaningless ?

Unless you've top balanced the cells, you don't KNOW that you're at 70% state of charge. The voltage chart of LiFePO4 cells is very flat. Two cells could be within .05v (making that up) and have very different states of charge.
 
What i use are cells really well matched (see that it is 0.00V difference , and use JK Active BMS :
As far as I can see your BMS is not reporting the delta correctly. Your highest cell is 3.318 and your lowest is 3.307. That's an 11mv delta. The highest cell should have red numbers and the lowest cell blue numbers. Am I missing something?
 
In summary, resistance is the MOST IMPORTANT PARAMETER in a battery to know , will dictate how fast you can discharge and/or charge it ..

If your priority is how fast you can load and unload energy, then internal resistance will be your priority measurement.

If voltage and capacity don't matter, only internal resistance, then you're looking at the wrong chemistry. You should be pursuing NiCd cells which can charge/discharge at rates greater than 5C, and have a lower internal resistance than most lithium cells.
 
As far as I can see your BMS is not reporting the delta correctly. Your highest cell is 3.318 and your lowest is 3.307. That's an 11mv delta. The highest cell should have red numbers and the lowest cell blue numbers. Am I missing something?
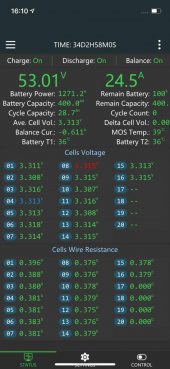
This is another picture . The bms keeps the flow of current until 0.05V difference is 0. Values change many times every second and probably averages are used by bms. Instant screenshot indeed have some more than 0.05 different hat that is normal after one pair balancing .

CAB932A9-5009-4E98-A130-C4F325F7A314.png
 
If your priority is how fast you can load and unload energy, then internal resistance will be your priority measurement.

If voltage and capacity don't matter, only internal resistance, then you're looking at the wrong chemistry. You should be pursuing NiCd cells which can charge/discharge at rates greater than 5C, and have a lower internal resistance than most lithium cells.

good point, but I want to have a way to identify good cells from bad ones and avoid problems caused by high unbalance in series of 16s
 
Thank you for the answer.

1) All cells are 3.296V and arrived with this voltage, this means 70% state of charge when tested
2) No, but what is the difference between 70% and 99% charge amount when being tested for 3 seconds ?
All my cells came in at 3.296v also, i did a single cell capacity test, and they all had ~106ah capacity at that voltage, which translate to a soc of ~ 36%.

I then took all the cells that were the same capacity and made a balanced battery.
Once the cells are top balanced and matched, I don't use any cell balancer, of any kind, for using them you will eventually cause your cells to be unbalanced.

Hope this little bit of information helps someone to clarify soc.
 
The only definite thing about cell resistance is it will increase with age/cycles.

With the mention of bloating, if it is truely bloating, is caused by electrolyte breakdown usually the result of overcharging or high cell temp. Other chemicals released from electrolyte breakdown coat the anode and cathode surfaces blocking off some of the lithium-ion transfer paths. This increases cell resistance.

Normal useage cycling grows the Solid Electrolyte Interface layer which gradually increases cell resistance and reduces cell capacity over its lifespan. Alway keeping near full charge or running high (>0.5C rate) current put extra stress on SEI layer causing it to thicken faster over life of cell., accelerating cell resistance increase and eating up more of available lithium which reduces capacity of cell.

An unusually low cell resistance for a new cell is not necessarily a good thing. It could mean the manufacturer short cycled the electrolyte protecting SEI layer growth process during the cell forming charge cycling process. The manufacturing SEI layer growth process consumes about 5% of cell's lithium so an incomplete SEI growth layer will also show with a bit higher cell capacity. This is a 'live fast, die young' proposition for cell however.
 
Last edited:
The only definite thing about cell resistance is it will increase with age/cycles.

With the mention of bloating, if it is truely bloating, is caused by electrolyte breakdown usually the result of overcharging or high cell temp. Other chemicals released from electrolyte breakdown coat the anode and cathode surfaces blocking off some of the lithium-ion transfer paths. This increases cell resistance.

Normal useage cycling grows the Solid Electrolyte Interface layer which gradually increases cell resistance and reduces cell capacity over its lifespan. Alway keeping near full charge or running high (>0.5C rate) current put extra stress on SEI layer causing it to thicken faster over life of cell., accelerating cell resistance increase and eating up more of available lithium which reduces capacity of cell.

An unusually low cell resistance for a new cell is not necessarily a good thing. It could mean the manufacturer short cycled the electrolyte protecting SEI layer growth process during the cell forming charge cycling process. The manufacturing SEI layer growth process consumes about 5% of cell's lithium so an incomplete SEI growth layer will also show with a bit higher cell capacity. This is a 'live fast, die young' proposition for cell however.
Thank you .
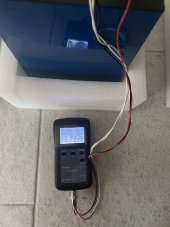
I get 144 cells called grade A CATL 310Ah with IR values between 0.28mOhm and 0.36mOhm.
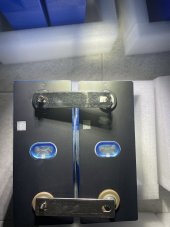
With bloating amount on all cells between 0.5cm and 1cm so max 0.5cm on a side.
What is the aging quantification of same lot batteries based on this amount of IR difference? I know factory quantify a 150% increase of IR as a complete defective battery. Is it linear degradation?

FE117B75-DAA0-4211-98D2-38023B584EB2.jpeg
260CFAC3-5A5B-4036-A330-22C26F951EDA.jpeg
 
Even my Bolk EVE-280's are between .14-0.19. All of the batched ones are were / are 0.18.
Measuring IR at static storage voltage is not very reliable. Once Top Balanced and saturated and after 40hours of settling in parallel so that the cells are all as even as possible, is also when it is best to test the IR.

All blue cells (rectangular aluminium, they are not much thicker than a pop can) do bulge a wee bit on the wide side, they all do BUT not significantly and it is relative to Temp & SOC as well.

This type of cell especially requires a "Fixture" which means they need to be bound and slightly compressed when assembled into a pack. They will expand & contract during their operational cycles & relative to temperatures.
 
Back
Top