diy solar

diy solar

More interesting cycle life data

FilterGuy

Solar Engineering Consultant - EG4 and Consumers
Joined
Nov 26, 2019
Messages
7,914
Location
Los Gatos CA
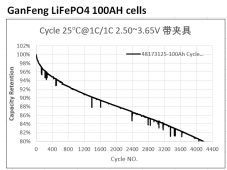
Here is an interesting chart on Cycle Life:
1682433497965.png

Look at the charge and discharge rate. 1C for both and they still lasted over 4000 cycles before they hit 80%. In a typical solar installation, the charge and discharge rate won't be anywhere near that high. I can easily imagine a cycle life of 8000 or more in a solar application. 8000/365=22 years....and that assumes a full cycle every day!!

I believe SOK and EG4 use these cells. I am not sure who else uses them.
 
Graphs all well and good, time will tell.

Hopefully everything connected to cells are also up to the task. One bad cap or surface mount component can make for a bad day.
Yup.... 20 years is a long time. I suspect other things besides cycle life will break a system before then. (How many 20-year-old pieces of electronic equipment do you have? ) The good news is that cycle life appears to be a factor we don't have to worry about.
 
Define what you means by "cycle".
One full discharge to 0% SOC followed by full charge to 100% SOC. That is what this test did over 4000 times.

In real life, it is rare to see seels fully charge and discharge in sequence. Usually, there are a lot of partial discharge charges and a smaller number of partial charges. Consequently, it gets a little hard to relate a full cycle to what is happening in real life. As a first approximation, a series of partial charge & Discharge cycles can add up to the equivalent of a full cycle. As an example, two cycles of going from 100% to 50% would constitute one full cycle. Some BMSs do cycle counts this way.

'Equivalent cycles' is *not* a perfect match to the cycle count the test did, but it is a reasonable first approximation. In most solar installs, the batteries are rarely fully cycled in a day (Either real cycles or equivalent cycles). Furthermore, it is rare to charge or discharge at a full 1C. (I try to design a system to be charged at around .3C or less and never above .5C). Charging and discharging slower tends to wear the battery slower so you get more cycles or equivalent cycles out of it.
 
But wait.. was it in a "fixture" or not ?
That's pretty funny.... but it touches on a good point. You might be able to improve cycle life with a compression fixture.... but is it worth it?
 
One full discharge to 0% SOC followed by full charge to 100% SOC. That is what this test did over 4000 times.

In real life, it is rare to see seels fully charge and discharge in sequence. Usually, there are a lot of partial discharge charges and a smaller number of partial charges. Consequently, it gets a little hard to relate a full cycle to what is happening in real life. As a first approximation, a series of partial charge & Discharge cycles can add up to the equivalent of a full cycle. As an example, two cycles of going from 100% to 50% would constitute one full cycle. Some BMSs do cycle counts this way.

'Equivalent cycles' is *not* a perfect match to the cycle count the test did, but it is a reasonable first approximation. In most solar installs, the batteries are rarely fully cycled in a day (Either real cycles or equivalent cycles). Furthermore, it is rare to charge or discharge at a full 1C. (I try to design a system to be charged at around .3C or less and never above .5C). Charging and discharging slower tends to wear the battery slower so you get more cycles or equivalent cycles out of it.
You also have to account for calendar aging. The fact that LiFePO4 cell vendors sell at a discount after cells have been stored in the warehouse for a full year tells you everything you need to know about how significant calendar aging can be even if cells are not being cycled at all...
 
That's pretty funny.... but it touches on a good point. You might be able to improve cycle life with a compression fixture.... but is it worth it?
So you are saying that the test data is indeed without a fixture? I'm on the "no fixture" religious zealot side now so just wanted to confirm. Biggest issue is all the pre-made busbars are designed for the cells to be smooshed together and not given enough space to expand slightly.
 
You also have to account for calendar aging. The fact that LiFePO4 cell vendors sell at a discount after cells have been stored in the warehouse for a full year tells you everything you need to know about how significant calendar aging can be even if cells are not being cycled at all...
Yes. I (and others) have often pointed out that calendar aging is more likely to get you before cycle aging.
 
So you are saying that the test data is indeed without a fixture?
I don't know if they were in a fixture or not. Sorry

I'm on the "no fixture" religious zealot side now so just wanted to confirm.
I am not sure I am a zealot about it, but I agree. Even if the test used a fixture and you discount it down to 3000 cycles at 1C/1C.... the numbers are still big enough that cycle life should not be a concern. Something else will get you first so trying to extend cycle life has limited return on the effort.
 
One full discharge to 0% SOC followed by full charge to 100% SOC. That is what this test did over 4000 times.
That's not what many BMSs or battery manufacturers count as a cycle for warranty purposes. "Cycle" is not a particularly well defined term, which is why I ask.

That chart told us what it used as a cycle count (i.e. using upper and lower voltages and charge/discharge current levels). Be good if you could post a link for it.

Often a cycle count is incremented when the total cumulative discharge has increased by 80% of the battery's rated capacity. That's what a lot of BMSs use.

Personally I just think total energy throughput is a better guide. Removes the confusion on what a cycle actually represents.
Whatever a cycle exactly is, they will last for a very long time when used as ESS for most home users.
 
That's not what many BMSs or battery manufacturers count as a cycle for warranty purposes. "Cycle" is not a particularly well defined term, which is why I ask.

That chart told us what it used as a cycle count (i.e. using upper and lower voltages and charge/discharge current levels). Be good if you could post a link for it.

Often a cycle count is incremented when the total cumulative discharge has increased by 80% of the battery's rated capacity. That's what a lot of BMSs use.

Personally I just think total energy throughput is a better guide. Removes the confusion on what a cycle actually represents.
I agree, but that should be taken as an upper limit with calendar aging providing the lower limit.

You can not get more lifetime than calendar aging limits provide for, regardless of how little energy throughput you’ve used in your battery.

You cannot get more lifetime than energy throughput limits provide, regardless of how new your battery is.
 
Back
Top